What Should a California Home Cost? Price and Income Ratios. Various Market Ratios to Determine Real Estate Valuation.
I want to focus our attention on housing valuation. For those calling a bottom, it is also implied that they believe that incomes have stabilized and that prices rightfully reflect the economic situation of the potential buyers. Why else would you call it a bottom? Yet very little analysis is done regarding housing valuation. There is much yelling and punditry about a bottom but little long-term analysis is given to support this argument.   Given the amount of Alt-A and option ARM products in California, we have unique exogenous factors that will play a role in housing prices for years to come. We also need to examine the state budget deficit and the state unemployment rate that is now at 11.9 percent but most likely is over 12 percent and if we look at the more encompassing figure of U-6, the state is well over 20 percent.
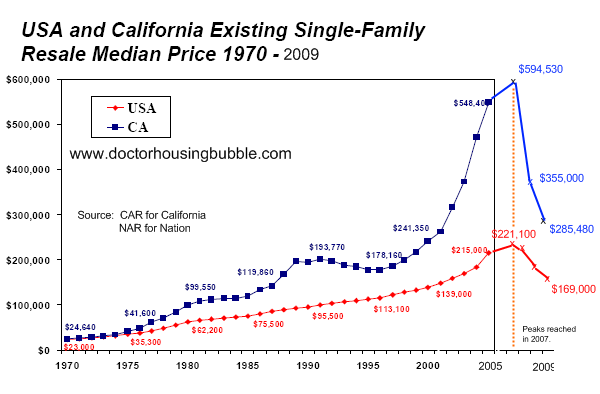
First some very important historical data. Did you know in 1970 the median price of a California home was no different than a median price home nationwide?
I’ve reconstructed the graph above. The graph had data up until 2005 but I added the key points from 2006-09. During the height of the bubble in 2007, a California home cost nearly three times as much as the median nationwide home price. Looking at historical data it wasn’t always more expensive to live in California. And this isn’t a new phenomenon either. Florida had an enormous housing bubble in the 1920s that burst in epic proportions. The real disconnect in prices started in the 1980s if we look at the chart above. California in the late 1980s had another bubble. At this peak, the price of a median California home cost twice that of a nationwide home. When things settled down, a California home cost 57 percent more than the nationwide home price. That was at the trough. Assuming a similar trough this time, if the median nationwide home price were to stay at $169,000 then a California median home price would go for $268,000. Yet there are things that are different this time.
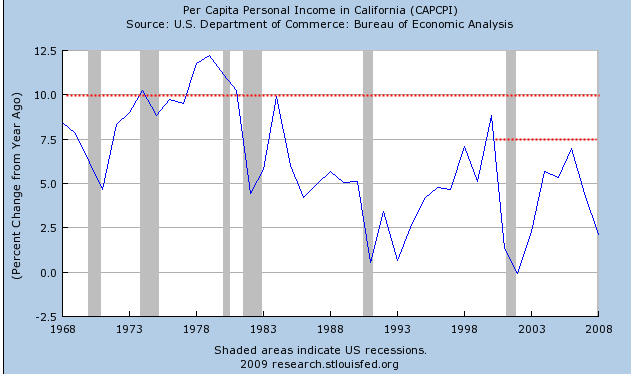
This time, California is not a booming economy. In fact, it is currently adding downward pressure. California heavily relied on real estate for the boom. So in the 1990s we had the technology boom and during the 2000s we had the real estate boom. Those are no longer able to support massive premiums on California housing. And one thing that didn’t occur was strong wage gains even during this decade:
What you’ll notice in the chart above is during the 1970s, Californians saw strong per capita income growth. A large part of this was due to inflation. Home prices went up but so did incomes. In our current bubble, home prices shot up while per capita income was stagnant. Much of the growth was completely dependent on housing alchemy including Alt-A and option ARM toxic waste financing the housing mania in the state. As the chart above clearly highlights, once the elixir was removed so was the artificial price gains.
That is the question that very few seem willing to explore. Without these toxic products, the buying power of Californians is largely diminished. For the entire decade, easy credit loans allowed the bubble to take on a wild uncharted path of growth. Yet as we deflate, what should a California home sell for? Let us run some current numbers.
Later this month, the Census will have more accurate figures for 2008 and these will undoubtedly be lower but for the moment, we will go with the latest data available:
California Median Household Income:Â Â $60,000
California Median Home Price:Â Â Â Â Â Â Â Â Â Â Â Â $285,480
Let us assume the median California family was looking to buy a median California home. As we know, FHA loans are now very popular and only require 3.5 percent down. Let us run the numbers:
Down payment:Â Â Â Â Â Â Â Â Â Â Â $9,991
Mortgage:Â Â Â Â Â Â Â Â Â Â Â Â Â Â Â Â Â Â Â Â $275,488
PITI:Â Â Â Â Â Â Â Â Â Â Â Â Â Â Â Â Â Â Â Â Â Â Â Â Â Â Â $1,904 (30 year fixed at 5.75 percent)
This is well and good but what can this household really afford?
At this ratio, this household is unable to afford the home:
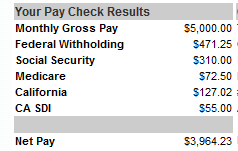
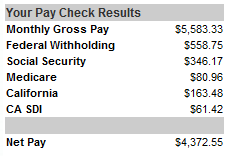
$1,904 / $3,964 = 48 percent on the front end ratio
As we discussed before realistically you need to fall within the 30 to 39 percent range to be safe. And that is with the back end ratio. We still haven’t factored in credit card payments, auto loans, student debt, and other monthly charges that will only make the ratio look worse. So two things happen at this point. Either incomes increase to make the ratio more appealing and stable or home prices continue to drop. Given our high unemployment rate in the state, it is rather clear that home price will continue to fall.
Keep in mind in the scenario above we did not factor in health insurance costs or contributions to a retirement plan and that would only make the ratio go higher and thus make housing less affordable. And if you were tired of bailouts, we might be dealing with another one regarding FHA loans:
“(WSJ) In the past two years, the number of loans insured by the FHA has soared and its market share reached 23% in the second quarter, up from 2.7% in 2006, according to Inside Mortgage Finance. FHA-backed loans outstanding totaled $429 billion in fiscal 2008, a number projected to hit $627 billion this year.
Rising defaults have eaten through the FHA’s cushion. Some 7.8% of FHA loans at the end of the second quarter were 90 days late or more, or in foreclosure, according to the Mortgage Bankers Association, a figure roughly equal to the national average for all loans. That is up from 5.4% a year ago.
Resulting FHA losses are offset by premiums paid by borrowers. Federal law says the FHA must maintain, after expected losses, reserves equal to at least 2% of the loans insured by the agency. The ratio last year was around 3%, down from 6.4% in 2007.”
It should be rather apparent why these loans are defaulting. A 3.5 percent down payment is too low. I would argue that at a minimum, if the government is to back a loan we should use a 10 percent down payment floor with strict debt to income ratios. Yet this is what happens when the government and bankers try to push housing regardless of what the valuations are telling us. And what they are saying is this – home prices are still too expensive.
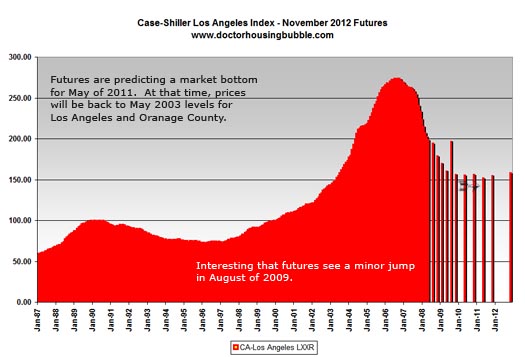
It was interesting that a long time reader sent me a graph that I put together last year looking at the Case-Shiller data and a funny thing shows up:
Source:Â Doctor Housing Bubble
I put this chart together in August of 2008. The bars reflected futures prices for L.A./O.C. based on the Case-Shiller data. But I notice that for whatever reason, the futures were pricing in a slight jump in August of 2009. Well guess what, we got that. Now how did someone see this one year down the road? I have no idea. But if someone had a clue regarding the tax credit timeline or moratoriums hitting at this time in the state, then they knew it would go up.
Futures contracts for the L.A./O.C. area point to slightly lower prices hitting some time in 2010 and 2011. This however does not reflect that many areas like Culver City, Pasadena, Palms, or other so-called prime locations will start seeing more declines as the Alt-A and option ARM products hit in full force in 2010.
Ultimately prices need to reflect what the local population can afford. We are still in some areas pricing homes via the “I’ll stay here for 3 to 5 years and then sell with big appreciation” model of valuation. That is simply a wrong way to look at real estate. It won’t work. Take a look at the increasing defaults with prime mortgages. The issue at hand is without a stable and healthy employment climate, home prices will begin declining reflecting weaker consumer demand.
Let us run one example. Look at the 91505 zip code of Burbank:
Current median price:Â Â Â Â Â Â Â Â Â Â Â Â Â Â Â $491,000
Median household income:Â Â Â Â Â Â Â $67,000
3.5 percent down payment:Â Â Â Â Â Â $17,185
Mortgage amount:Â Â Â Â Â Â Â Â Â Â Â Â Â Â Â Â Â Â Â Â $473,815
PITI:Â Â Â Â Â Â Â Â Â Â Â Â Â Â Â Â Â Â Â Â Â Â Â Â Â Â Â $3,276 (30 year fixed at 5.75 percent)
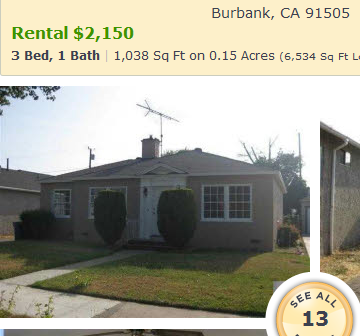
Therein lies the problem. 74 percent of the household income is going to go to the home payment. First, FHA would never finance this loan but you can see how some areas are still over priced. The median price is $390 per square foot. So let us look at some rental data. I pulled up this rental in the same zip code:
This home according to the $390/per square foot price would sell for $404,820. There is a big difference between $3,276 a month and $2,150 a month. And that is the disconnect. Until these markets reach more realistic valuations, the bubble will continue. Yes, owning a home will always be more expensive than renting but by how much?
Another method of valuation is the income method. I use this method on investment properties. First, what you need to do is take a look at the cash flow situation:
(Property gross income) – (All expenses excluding the loan payment) = NOI
So let us use that rental that we found. Most real estate investors will tell you that expenses will cost anywhere from 40 to 50 percent. Yes, they do run that high. Let us use 45 percent for expsenses:
($25,800) – ($11,610) = $14,190 NOI
Now what do you do with this number? Depending on local area “capitalization rates” you can find a price that an investor would pay. Let us assume a cap rate of 6 percent which by the way is in line with national rates:
$14,190 divided by .06 = $236,500
That is a long way from the $491,000. Now why is that? Well you have to refer to the initial chart in this article. There is still this implicit belief that California will once again out pace national appreciation rates well into the future. So not only are you paying for the income of the property, but you are speculating on the appreciation of the home. The Alt-A and option ARMs played into this speculation perfectly. These loans were never designed for the long-term and were developed for short-term usage (as in flipping a home). With no appreciation or stagnant prices, why would the premium still exist? That is the question for the next few years.
Either way, it is important to understand real estate valuation because ultimately, you can run these numbers yourself to see if a home is valued at the right level. Someone screaming that this is the bottom with no evidence is no better than the person saying the bubble prices were justified. In fact, it may be the same person.
 Did You Enjoy The Post? Subscribe to Dr. Housing Bubble’s Blog to get updated housing commentary, analysis, and information.
Did You Enjoy The Post? Subscribe to Dr. Housing Bubble’s Blog to get updated housing commentary, analysis, and information

 Subscribe to feed



31 Responses to “What Should a California Home Cost? Price and Income Ratios. Various Market Ratios to Determine Real Estate Valuation.”
Thank you! This is the most logical explanation of home value I’ve ever seen!
Now, if only mainstream media would pay some attention!
One question about the methodology – if the bottom 40% of incomes are not owners, doesn’t the median home price need to be affordable to the 70th percentile owner rather than the 50th? Of course, I believe that many areas, including the ones you cite, ARE dramatically overpriced, but we may overestimate the required correction if we are aiming for the median household to be able to afford the median home without excluding all the people in a given area who are not realistic potential buyer/owners.
Naw he gets nasty
Comrade HB,
I got a laugh out of your last two sentences: “Someone screaming that this is the bottom with no evidence is no better than the person saying the bubble prices were justified. In fact, it may be the same person.” Yes, in fact, it is the same people and they’re the NAR shills blathering away in the press all the time.
~
To JimAtLaw: What you say makes sense, but the rule that the average home in an area sell for 2 – 3 times the average household income in that area has been accurate for many decades — certainly as long as I can remember. It wasn’t until the flood of undeserved loan money (no-doc, NINJA, etc.) that it went crazy. And never forget that forty years ago, a single middle-class income was enough to buy a house, feed a family, get the occasional new car and take a vacation. Things have, indeed, been going downhill for that long to where, in most areas, even two middle-class incomes (like husband and wife) are lucky to live such a life.
Your calculations are correct, if you coldly make a rational decision.
However, the U.S. has 29 million foreign born residents, of which
8 million live in California.
For immigrants, particularly from Asia, owning property, even if it overpriced,
is the Ameican dream. They will double or triple up, pay 60% of their income,and borrow from relatives to buy in CALIF.
This will always mean that homes in Ca. will cost more than the national average.
Another great post Dr.
However, as bearish as I’ve been and still am on CA real estate, I would argue with the 6% yield and how you arrived at the value of the classic thousand square foot Burbank home.
I believe the long-term net dividend yield (rent minus all expenses except mortgage) for smaller homes and condos was 5% for decades until the roaring 2000s. I also would strongly suggest that 45% in costs makes no sense for a 1000 sq ft home (did you get that from John T. Reed? I think he’s completely off-base generalizing on such expenses).
Here’s what I tell my clients: take the $25,800 and subtract long-term obsolescence, repairs and maintenance–I’d argue $3,000 per year for this sized home, factoring in apparent age; property taxes, which we have to work in backwards (since price paid determines property tax)–I’d suggest $3,000; and insurance of $500. Net = about $19,000, which is 5% of $380,000. Oops–property taxes would be $4,500 at that price, so we get net $17,500 and value of $350,000.
However, I’d suggest that the popping of a bubble this size will push prices far below the “norm,” so I’m telling clients it may be ok to buy in city areas (particularly if they intend to live there for a substantial period) when the yield is 7.5% (12% perhaps for outlying areas). $19,000 is 7.5% of $253,000 (and this figures in property taxes of about $3,000, which would be about right).
Another several “however’s”: 1. rents could easily drop from current levels and I would factor that in; 2. I don’t count vacancies, which should perhaps be counted; 3. I may be low on long-term repairs and maintenance, so be careful there; 4. I don’t take into account management costs, if any, or headaches if you do it yourself; 5. I’m not taking into account the possibility of the tenant from hell trashing the place.
Factoring all these in and you could, as I tell my wife, be right.
The high housing cost to income ratio in southern CA is a real problem but maybe not for the reason that you might think. In large cities around the world (including the US), transportation costs represent a relatively small share of income because people walk or take transit. This allows more money to go to housing (and other things). In southern CA, walking or taking transit is counterculture. In fact, if gas prices were to go north of $4 again (which it will), any recovery of housing prices in outlying areas will get pummeled. It is no coincidence that foreclosures started at the fringe of metropolitan areas and prime areas (those with a mix of land uses and/or close to transit) will be affected the least. The car which has been so central to life in southern California will be its ultimate undoing. Don’t feel so bad. Most of the Sun Belt will likely suffer the same fate unless substantial changes in land use and transit policies are implemented. Look at the bright side, this will support housing prices and maybe avert a complete financial meltdown (not to mention reducing green house gas emissions). And you thought going green was some kind of liberal fantasy talk when if fact, it could be our salvation.
There is a way forward but bubble blowing ain’t it. Change is coming. We can either plan for it or let it happen to us. I’ll leave you with one of my favorite quotes: “More than any time in history, man faces a crossroads. One path leads to despair and utter hopelessness. The other to total extinction. Let us pray we have the wisdom to choose correctly.” – Woody Allen
Long-time reader; first-time commenter. Love your column. This time, however, I believe you reversed the numbers in the equation. By my calculations, 45% of the $25,800 annual gross income from the property would be $11,610, leaving a NOI of $14,190, which at a capitalization rate of 6 would result in a property value of $236,500. If I simply misunderstood your calculations and mine are wrong, then I apologize.
A research article published here
http://www.westwoodcapital.com/opinion/images/stories/reconstructing_american_home_values_alpert_082009.pdf
finds that the historical ratio of house values to average rent is 11.4 to 13.8 times. This would indicate that a stable value for the Burbank house would be in the $290k to $350k range. Expressed another way, historically annual rents as a percent of house values are in the 7% to 9% range.
I live in Westchester county, New York and asking rents have been coming down significantly. These lowere rents in and of themselves will contribute to a decline in home values.
“if the bottom 40% of incomes are not owners, doesn’t the median home price need to be affordable to the 70th percentile owner rather than the 50th?”
I completely agree. It is inaccurate to compare median home price with median household income, and that is commonly overlooked. It’s inaccurate for two reasons. One is that there are fewer houses than households. Every full time student in university housing and every single soldier in the military is a separate household. Using ACS 2007 estimates, there were 12,200,672 households but only 7,755,251 single-family detached houses.
The other is that some of these houses are owned free and clear by retirees.
Also, there’s a minor inaccuracy in take-home pay computation. Net pay 3964/month would be accurate for a renter household, but a homeowner household with a house in 250-300k range would bring home slightly more, roughly 200/month more.
A research article published here
http://www.westwoodcapital.com/opinion/images/stories/reconstructing_american_home_values_alpert_082009.pdf
finds that the historical ratio of house values to average rent is 11.4 to 13.8 times. This would indicate that a stable value for the Burbank house would be in the $290k to $350k range. Expressed another way, historically annual rents as a percent of house values are in the 7% to 9% range.
I live in Westchester county, New York and asking rents have been coming down significantly. These lowere rents in and of themselves will contribute to a decline in home values.
Sorry, forgot to add great post! Can’t wait to see your next post!
Part of the equation you left out, probably because to a great extent it is not quantifiable, is the upward pressure (countering the downward) of Government intervention.
Just as a median family income can strongly influence housing prices, the number of Government programs can strongly influence too.
Rental income expenses/vacancies are roughly 25% of income. The lender’s rule of thumb has worked well for me. My properties get the maintenance they need over the years without me having to fork out extra cash.
“Until these markets reach more realistic valuations, the bubble will continue. Yes, owning a home will always be more expensive than buying but by how much?”
I use,/www.krunching.com/ when considering investment property. Rare to find anything that meets good investment criteria in metro Calif.
Excellent post and would only add that it is difficult to measure risk in Calif RE market given the liquidity requirements necessary to keep asset values afloat.
Longtime reader, first time commenter. DHB, any chance you could examine the Santa Clarita area in a future column? I feel like this area is still disconnected from reality, but don’t have access to the same data sources you do.
Saw an Open House Foreclosure this weekend in North Hollywood 91601. It was approx 2,000 sq feet but that’s where the party ends. The hard wood floors were completely deeply scratched all over, filthy scuffed walls, some had little kid stickers on them, dirt lawn, etc. It looks like they took a trip to the Alt-A ATM to remodel the master bathroom and kitchen but they took all the appliances with them. And did I mention that the backyard was about 5′ X 20′? More like a dog run. Anyway, typical foreclosure property but they were asking $670k. I asked the realtard if he bumped his head. The mentality of people and the banks are just beyond me.
Doc,
99% of the stuff you write makes perfect sense, but in this article there are a few things that I think we should also consider.
1. The median income vs. median price issue that was mentioned above
2. The 45% cost which was also mentioned above.
3. Relates to the following quote.
“This home according to the $390/per square foot price would sell for $404,820. There is a big difference between $3,276 a month and $2,150 a month. And that is the disconnect. Until these markets reach more realistic valuations, the bubble will continue. Yes, owning a home will always be more expensive than renting but by how much?”
You compared the costs buying a $491k home versus renting a home that you valued at $404,820. The monthly cost of buying that you came up with is $3,276 verses renting for $2,150. At $390 a square foot the 491k home should be about 220 sq ft bigger. I would give that a rental value of $2/sq. ft/month more which would add $440 to the monthly rental price making the rental cost $2,590 a month which is closer to the ownership cost of $3,276 a month. Also, down payment higher than 3.5% would decrease the monthly ownership cost bring those numbers even closer together.
It seems to me according to these numbers that even rent is too high for the average household in this area. Isn’t the number supposed to be 3x median salary = median house price (in general)? $66,000 x3 = $198k which is a lot less than 404k. Maybe in pricier areas of SoCal it would be higher than 3 because a much higher portion of the population rents, but can you really justify a 6? I still say rents have to come down or you are gonna say a mass of vacant homes even in pricey areas. U-6 is 20%, and many people are losing their benefits. How are they gonna pay rent.
Not only are the ratios out of whack, but the Westside Sales Volume is now getting crushed over the last 4 years. For example:
Bel Air -93%
Beverly Hills – 87%
Santa Monica – 85%
Brentwood -80%
Not to mention Pacific Palisades, Malibu, Venice, Century City, Cheviot Hills, Rancho Park, Beverlywood, Westwood, Mar Vista, Culver City, West Hollywood,
Marina del Rey and West LA, all off by enormous amounts as well.
http://www.westsideremeltdown.blogspot.com
Again, I say that the massive retirement of Baby Boomers is going to have an effect on all of these things like nothing has in the past!
Today’s Dr. HB blog reminds me of the days when I lived in Reno with my then-husband and we bought a 1012 square foot house in 2003 and ended up having to sell it at one of the heights of the mania, in 2005.
Selling it was a horrible, intense experience. All these people came over to Reno from California to buy “cheap” houses which they all thought were going to go up in value massively. People were fighting over our house. The greed and avarice and sense of entitlement were sickening. While they were slobbering all over our little house in our open house, several people were giving our neighbors the Spanish Inquisition, as well.
I can’t help but smile a little now, knowing that that house increased in value, and then went back down to the price we bought it at.
Someone lost their down payment or more.
Good article; However, there is a major flaw in the calculations. It assumes that the median income will buy a median priced price, That assumption is incorrect. since home ownership rate in LA county are somewhere around 50 percent, then the assumption that the median income house hold will buy the low end house and median house will be purchased by median of the top 50% of the earners.
Unfortunately the only valuation given consideration is the market value applied by the appraiser. What was needed and should be included is a “tachometer” type figure that utilizes rents and/or area incomes for contrast to the “speedometer” of market value. If that had been done it would have been easy to see that during most of this decade the market was cruising along at higher and higher speeds but we were redlining the whole time in second gear. The appraisal community hides behind their “cost approach” and “income approach” via GRM that do nothing but parrot market values. I struggle to understand the resistance to incorporating some type of “rental replacement value” as a means to gauge risk and provide deeper perspective to all parties.
Great article. Is it possible to post an example of the income vs. mortgage for a situation in 1970? It would give some great insight into how far we have fallen.
To DS and JimAtLaw who wrote:
>>
“Comment by JimAtLaw
September 6th, 2009 at 1:39 pm
One question about the methodology – if the bottom 40% of incomes are not owners, doesn’t the median home price need to be affordable to the 70th percentile owner rather than the 50th? Of course, I believe that many areas, including the ones you cite, ARE dramatically overpriced, but we may overestimate the required correction if we are aiming for the median household to be able to afford the median home without excluding all the people in a given area who are not realistic potential buyer/owners.”
>>
Nope. The price of housing has to be distributed so that ALL the population can afford housing. If they don’t buy it, they have to rent it.
>>
The cost of buying a house which is to be rented as an income property MUST be low enough so that the rent covers the mortgage (principal & interest), earnings value of a downpayment, repairs, and some profit. Even if the idea is only to break even, the rent still has to cover the PITI & repairs.
>>
Ergo the average ‘house’ (Single family or condo) has to be priced so as to be affordable for the median population. Everyone needs housing.
Hey DHB, it’s been a while since I’ve dropped a comment ’round here (web monitors at work got notched up a bit this summer) but I’ve been been and enjoying the whole time.
–
One line in this article really rubs me the wrong way, though:
–
“Yes, owning a home will always be more expensive than renting”
–
This truly should not be the case. The only reason it was, was because people saw that houses had been repainted as equity-building assets. This idea is perverse. In the long term, house prices stay somewhat constant. This is why a rule of thumb like 1/3 of gross pay for house payment can and has worked for so long.
–
I suppose the way to really look at it is as such: If it costs more to buy a house than rent one, it is impossible to rent one out without losing money on the deal. *Somebody* has to own that house. And that means they have payments and a bottom line. The crackpot lending schemes and self-voted dollars of prop-13’s unfettered democracy in action are all that have allowed this perversion to subsist.
–
Another way of looking at it is to ask, “who rents?” The answer is that it is people who are unable to or unwilling to buy. In both cases, the proper line of thought should be that renting should cost more than buying — a renter remains a renter because of the lack of the ability and/or desire to remain tied to a property for the amount of time required to pay a mortgage. This is a convenience with a value above and beyond the value of the use of that property.
–
This serves as just yet another point where we need to look at history and understand the cultural mentalities that raised this current fiasco of an economy and hope that we’re not too late or too impotent to change it.
a renter doesnt own the home hes renting, and the same goes for the “home owner” until the mortgage is paid off.
“Another way of looking at it is to ask, “who rents?†The answer is that it is people who are unable to or unwilling to buy. In both cases, the proper line of thought should be that renting should cost more than buying — a renter remains a renter because of the lack of the ability and/or desire to remain tied to a property for the amount of time required to pay a mortgage. This is a convenience with a value above and beyond the value of the use of that property.”
Another factor in the history of renting as a choice was the lack of a down payment to qualify for a loan. Many people rented for years to save up the required 20% down in order to get into a home when the housing industry was tied to financial fundamentals. Landlords also put down 20 or even 30% and calculated the value of a “real” asset (the home and property) in holding that money while they calculated expense to rent ratios based on their mortgage payment (figuring in of course depreciation and deductions for business costs).
The world got out of wack with real estate joining in the financing gimmicks of consumer and auto loan credit tactics made possible by the de-regulation of laws protecting the fundamentals of mortgages.
And they don’t want to put it back to same practices. Their goal (govt and banks) is to survive ergo TARP and stimulus which we all know is debt forever.
God help us all cause I think we are stuck in the Woody Allen quote.
wait till the playing field is leveled,and you are working for the same wage as the chinese. might mean the recalculation of your cherished money pit of a house. since the only sure thing in this country is playing the lottery, i think ill stay mobil and let the landlord worry about the roof leaking or the hwh taking a crap.
As an example for an updated 3 bedroom, 2 bath, Tudor, 1350sq feet, in the 91505 zip, Zillow Price: $575.500 Down payment: 20% ($115,100) 30 Year Fixed: 4.70% $2,388 /mo . The place would rent for around $2400 a month. It is within walking distance of the studios, 7 minutes from the Airport, freeways, and trains, hence the high price. Burbank has a population of 100,000 and jobs of 100,000. In Riverside, this house would go for much less, but studio people don’t like the commute on the 210. Obviously, this location is not for families, but for people in the entertainment industry. Burbank has a population of 100,000 and jobs of 100,000.
I’m only 16 and me and my 14 year year old sister after college was wanting to buy/rent a house but I need to know how much it would cost for a medium size house?
Leave a Reply to Brianna Sterling