
The hidden costs from inflation in the housing market: 4 trends in the current housing market. Comparing nationwide trends and niche areas. Inflation adjusted home prices.
For vast areas of the United States home prices are close to inflation adjusted trend lines. With incredibly low interest rates courtesy of the Fed ballooning their balance sheet up to nearly $3 trillion, the government and the Fed are basically the main player in eating up mortgage backed securities. Over 95 percent of mortgage origination come from the government and are issued by the large too big to fail banks. This has now been the case since the housing bubble peaked and burst in 2007. When we look at prices nationwide you do see prices trending with longer-term inflation trend lines. However, with that said, we realize also that real estate is local and you can see this through manic like behavior in niche markets. One clear example I am seeing is with investors overbidding for investment properties. Another is with flipping in certain markets. By definition flipping is only profitable if you can sell in a timeframe where all expenses and lost time are made up by the profit you make on the sale. We’ll discuss some of this later in the article from an investor perspective but let us first look at home prices across the US.
Inflation adjusted home prices
Home prices are trending towards inflation adjusted levels:
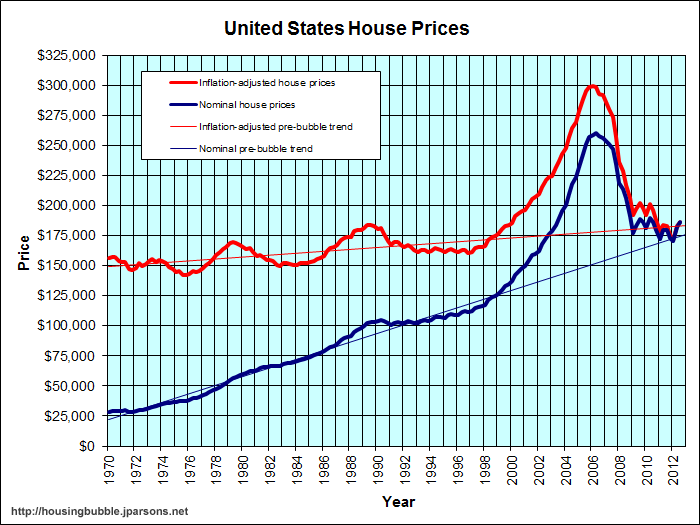
Home prices across this country are down by roughly 30 percent from the nominal peak reached a few years ago. You can see both the nominal and the inflation adjusted trend lines above. We are slightly higher on the nominal front in terms of the trend line going back to the 1970s but not by much. Yet what I would argue, is that home prices in our current environment are driven up not necessarily because the economy is doing so well, but because the Federal Reserve and government backed programs like FHA insured loans combined with low rates are injecting massive liquidity into the market. This was the boom in 2012. But can this continue? That is the big question.
What causes me to pause is when we look at household income. Let us look at this in a similar fashion:
Adjusting for inflation, household income is back to levels last seen in the 1990s. So in real terms, Americans are spending more money on a variety of items adjusting for inflation. In other words, most are losing purchasing power. This can be in the form of college education, healthcare, food, energy, or even housing. This is an important trend to understand because it highlights why the Fed has so aggressively pushed interest rates lower to make up for this lack of real income growth.
Percent of homes in distress
One argument that holds little water is when people look at the entire pool of available housing stock and then state that distressed properties are only a small portion of the entire market. First, at any given point and time only a small pool of homes are available for sale on the market. Even during the peak of the housing bubble this was the case. So any changes with inventory are going to have large impacts. This is why in a previous article we discussed how the drop of inventory in Los Angeles by 60+ percent in one year is shocking.
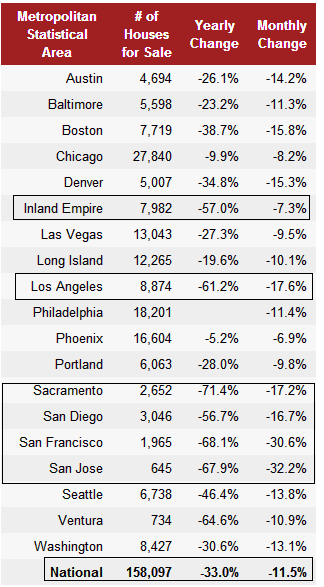
According to the Redfin data, last month there were 8,874 homes for sale in the Los Angeles MSA and this is a county with roughly 10,000,000! According to the latest Census figures 1.4 million homes in Los Angeles County are owner-occupied. Therefore that 8,874 of available homes represents 0.6 percent of the pool of homes for sale. So it should be rather apparent that at any given point, only a small pool of homes are for sale.
This also brings up distressed property. There are 25,053 homes in Los Angeles County that are either bank owned, scheduled for auction, or have received a notice of default. The amount of distressed property is nearly 3 times the amount of available homes for sale. In thinly traded markets like housing this does make a big difference especially when this inventory is not on the market for sale.
So nationwide and even in many parts of California, adjusting for inflation we are getting closer to trend lines. Yet this is being driven more by the added leverage of the Fed and government backing of mortgages instead of solid income growth. But let us look at a mid-tier selective market in Pasadena as a case and point:
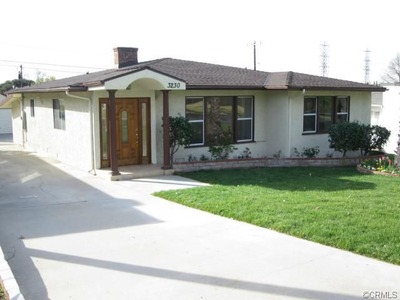
3230 E Sierra Madre Blvd, Pasadena, CA 91107
Bedrooms: 4Â beds
Bathrooms:Â 3.0 baths
Single Family:Â 2,256 sq ft
This is a very nice starter home for a family. Let us look at the price history:
This home sold in September of 2012 for $475,000. It looks like the house has had some recent work so hard to say these are flippers here but the home is now back on the market in less than five months. The home is now listed for $688,800. Did enough work go into this property to add $213,000 in value over the last five months? Cases like this make me believe we are seeing bubble like behavior with flippers. Why? Justify that $213,000 price increase in such a short duration. As someone that understands and works with investment properties, I would simply like to see how that added value occurred over this short period of time.
Opportunity Cost
Another case is opportunity cost when buying a home. In many mid-tier and prime areas of California for example you would need 20 percent down to reach this. Very few people have twenty percent down and this is why FHA backed loans have been used as stop-gap since the private mortgage market dried up in 2007. Now let us use the above home sale as an example again. At the current price you would need:
List price:Â Â Â Â Â Â Â Â Â Â Â Â Â Â Â Â Â Â Â Â Â Â Â Â Â Â Â Â Â Â Â Â Â Â Â Â Â Â Â Â Â Â Â $688,800
20% down payment:Â Â Â Â Â Â Â Â Â Â Â Â Â Â Â Â Â Â Â Â $137,760
PITI:Â Â Â Â Â $3,340 (3.5% 30 year fixed rate)
Now assume that you get a rental for the same price. Okay, after 30 years one person has a paid off house and another has paid rent and has no home. However, that 20 percent down payment of $137,760 could have been invested. Say it was invested at a rate of return of 7 percent in the stock market. This alone after 30 years of compounding will be $1,048,664. Of course the home itself would have adjusted because of inflation as well. However, if you look at Japan with massive quantitative easing, home prices are back to levels last seen 30 years ago. So the equation is not as simple as saying that those currently renting are simply flushing their money down the drain especially in areas where a massive down payment is required to get to rental parity.
To reiterate however, for vast parts of this country home prices are back to historical trend lines but in niche markets, where many readers I presume would like to buy, the decision isn’t so clear cut. The above example and many others provide a glimpse as to what is going on.
Investors over estimating profits
My next point is the over saturation of investors in the market. In California, going back to 2008 investors have purchased anywhere from 25 to 30 percent of all home sales. This aligns with nationwide trends. However in places like Las Vegas and Phoenix roughly half of all home sales have gone to investors. This is not a normal market. So whenever you look at sales charts, you have to factor in this figure to realize a good amount of volume is coming from a group that has very little historical comparison. In no time in US history have we had roughly one third of home purchases being made by investors (outside of the housing market of the last decade or so). It is hard to say what happens when this money flows back to other areas.
Another over exuberant trend I am seeing is with bidding wars and over estimating profits. For example, I have communicated with colleagues that are investors out in the Inland Empire. There are cases of auctions being over bid in a frenzy and blasting through any reasonable ratios in terms of rental income or even for fixing up and then flipping. In fact, you are seeing hedge money slowing down in many areas.
If you talk with long-time professionals you will realize that over time, you will realize that roughly half of your gross rents will go to outside costs beyond the principal and interest. These costs include but are not limited to; taxes, insurance, replacing roofs, carpets, damaged walls, and vacancies. I think people underestimate these costs. A simple rule for most investors is never consider a property if it cannot yield at least 1 percent of its sales price on a monthly basis. That is, a $100,000 home should throw off at least $1,000 a month. Sure, your principal and interest is low but taxes, insurance, vacancies, and repairs remain steady. Also, for investment properties you are looking at 20 to 25 percent down. In the Inland Empire I’m seeing places sell for $200,000 that will rent for $1,200 to $1,400 a month. These are not cash cows.
What I suspect from many readers is that they are looking to buy in thinly traded markets where inventory is incredibly scarce and you have a good amount of interest; foreign money, hedge funds, flippers, FHA insured loan buyers, and your regular conventional buyer with a solid down payment. You can pull up the income figures for these zip codes and see that home prices are 8 to 10 time current household incomes versus the 3.5 for nationwide home prices. That is a big difference.
 Did You Enjoy The Post? Subscribe to Dr. Housing Bubble’s Blog to get updated housing commentary, analysis, and information.
Did You Enjoy The Post? Subscribe to Dr. Housing Bubble’s Blog to get updated housing commentary, analysis, and information
 Subscribe to feed


73 Responses to “The hidden costs from inflation in the housing market: 4 trends in the current housing market. Comparing nationwide trends and niche areas. Inflation adjusted home prices.”
A 7% return in the stock market would be great! If I could get that, I wouldn’t be invested in SFR rentals. The return on rentals as investments is better when you don’t use borrowed money, since a vacancy doesn’t cost you any money out of pocket, and you don’t have to pay interest. I agree with the DR. that ideally the rent should be 1% of the sale price the house, but that is hard to find.
I haven’t had any trouble getting a 7 percent long term return in stocks, patience.
Muni Bonds are another way to go, no tax and sure income
Research dividend paying and high quality corporate bond funds. Vanguard has a few gems, averaging about 6% over the last twenty years, and at low costs.
In the last 25 years, nearly any investment could return 5%+. Even CDs the last 25 years probably averaged 5% per year.
Right now, the next 25 years somehow don’t look as promising, certainly not in bonds or CDs. Maybe commodities or stocks?
That 7% ROI after 20-25% down doesn’t take into consideration the accumulation of principal does it? When you factor that in as well, it makes RE look a lot better. After you pay off that 15/30 year note what kind of return would you be looking at then?
I wonder if the magic 7% return accounts for capital gains taxes when you eventually have to sell? With the first 500K profit (if married) being tax free when selling a home, that’s a smoking deal. Who knows how capital gains taxes and real estate sales taxes will change in the coming years, I imagine both will go up.
Capital gains taxes depend on the situation, if you have already maxed out your 401k, IRA contributions, than you would be subject to capital gains taxes. But i imagine many people who stretch themselves to get into a high cost loan will not have money left over for retirement savings. I know it is hard for me to save 2 x 17k + 2x5k IRA, and still afford an expensive home.
Your household income chart says it all. Combine this with real inflation numbers (not phony government numbers), record agriculture commodity prices (food), high gasoline prices, increased taxes and healthcare costs, continued drop in worker participation rates and you have a smoldering disaster on your hands.
And let’s get this correct once and for all. Real estate prices have NOT increased, interest rates have fallen. If one factors in what real interest rates should be, real estate has dropped way more than 30%. When central planning destroys the market by manipulation, the results are always much worse than if the free market is allowed to work. I find it highly ironic that the US condemns Fidel and Chavez et al for manipulating markets, price controls and state takeover of the private sector. What do you think the FHA has done to the mortgate and the housing market?
What is the disaster you refer to?
I’m not a fan of gov’t manipulation of rates, but this is the reality we live in today.
Personally, I don’t think home prices will drop much when interest rates rise. I understand that there is normally an inverse relationship. However, in this instance, I think rising interest rates will lead to lower inventories (people underwater refuse to sell, and investors / home owners who need to move will just rent out their homes for positive cash flow). The low inventories will keep pricing pressure upwards or neutral.
I think the only way for home prices to drop significantly is for developers building more rental units / new homes. Even then, inflation will temper the price drops. Just my 2 cents.
Price necessarily go down, because when rates rise, buyers are not able to finance as much as they could when rates were low.
I think many owners who need to move (bought between 2000 and now) will be renting out for negative cash flow.
Pugtv, there have been multiple examples all over the US throughout multiple decades of home prices increases as interest rates rise.
Govt manipulation never ends well for anyone. We are just repeating the last cycle with the FHA 3.5% minus the liar loans.
For those who would like a logical explanation of the relationship between mortgage interest rates and house prices please see below.
http://www.europac.net/commentaries/higher_mortgage_rates_equals_lower_home_prices_its_basic_supply_and_demand
What disaster am I referring to? The one we are currently living through and which will become much worse with time. If you cannot see the stag-flation and the trillions of dollars in debt overhang from all quarters, then there is not much I can do for you. This a worldwide systemic problem that will eventually blow up. Read a little history of what happens when debt is unpayable. And, today’s levels are unprecedented.
Even the LA Times can see through the monkeyshines of Jerry’s “balanced budget”.
http://articles.latimes.com/2013/jan/13/local/la-me-state-debt-20130114
In a vacuum, rising interest rates = declining home prices makes sense, but we don’t live in a vacuum. Rising interest rates can be a sign of a overheating economy while falling interest rates can be of a struggling economy.
It’s easy to find period of falling interest rates AND falling housing prices. If you want to find a time of rising interest rates, just look at the US in the 70s – 80s. Rates went from 7% to 17%. Did housing prices crater with that immense rise? No. Housing prices also climbed about 25% during that period of rising interest rates.
The correlation exists only in a math formula.
@ Cowabunga
“there have been multiple examples all over the US throughout multiple decades of home prices increases as interest rates rise.”
Give me the time period and I’ll look it up … better if you have the specific information so it will save me the hassle.
@ MB – The period of rising interest rates accompanied by rising home prices that you are referring to is a very unique time period in US history when baby boomers were just graduating from college and looking to buy houses for their new families. Because of this, this was a very special time of ridiculously high demand that even high interest rates couldn’t quench.
In contrast to our present day, we do not have any similar reason to suspect such sudden high demand so the standard will remain – interest rates go up; prices go down.
Thank you Jeff Beckman….that was a good one
RE: Cowabunga “there have been multiple examples all over the US throughout multiple decades of home prices increases as interest rates rise.”
Please cite them because the only one I know of is the boomers moving into the market with mega inflation and then Volker jacking rates to control it. Very different demographics with MAJOR wage inflation during that period. If you believe wage inflation will come and a big slug of people will be buying homes – I can see this being the result. And you know what, when the wages stopped rising quickly and rates moved down…this was the catalyst for a 30 year real estate boom.
However, if there is no wage inflation people are down to current incomes which comes down to a monthly payment mentality such as we have today. This is why rates are lowered in order to let those same wages stretch for another 30%+ of home value to support the market. Hold those wages constant and move rates much above 6% and it’s a 30% hit in housing values. Alternatively let food/fuel necessities increase faster than wages and it’s less money for housing beyond the bare minimum.
Honestly, I’m familiar with housing trends and rate paradigms well beyond the 1970s where most people’s data ends and that’s the only clear example I know of. Certainly you might find a niche area (location/location) which can fight a trend, but nothing else supports that rate increase is fine for housing values rationale. If you have alternative examples I’m interested – not arguing but I really have never seen another illustrated.
Slim, read Martin Armstrong’s writing about the rate. Interest rate is the last to move in response to economic activity in comparison to stock, bond, housing etc.. If you remember the mortgage rate was at 6% in 2005, when we had highest housing price, and we had 3% rate in 2009 when we had lowest housing price.
Doc’s income graph is not quite correct. I don’t know where he got his data. I posted this before. This was from the census bureau.
http://www.davemanuel.com/median-household-income.php.
Pete, you deserve to just go to the corner and keep your back to us for an hour after typing that. To use price levels from the very top of the biggest housing bubble in history and then the first major bottom, three years after that bubble burst, is just plain dumb. No dessert for you tonight. To your room!
Pete – I see what you are saying I don’t disagree in that you can keep a trend going in the face of headwinds to some extent (i.e. housing and especially momentum in housing as it’s emotional and levered is like turning a supertanker – especially during those years). That said there are some caveats in those times that are important to consider if someone wants to extrapolate into the future (i.e. the mistake many quants made especially on the mortgage side is that they had no concept of fundamentals underlying the data and took only very limited data and correlations at face value):
2005-2007:
While interest rates were moving up the housing race started to take on some major issues at this point. This extension was fueled not just on emotion but also on fraud at the origination/underwriting level (demand for credit) combined with even more credit driven leverage and greed at institutions (supply of credit). This period is where we saw the loan pools begin to default very quickly as increasing percentages couldn’t even make the first few months of payments. It will be hard to repeat that experience and it proved to be highly unsustainable even in the best case scenario as it was not fundamentally driven. Higher percentages of legit borrowers had already maxed out their monthly payment budgets with every other trick and there was no legitimate way to keep it running. This experience would seem to indicate that increasing rates is effective even when the whole world wants to believe otherwise and fight their hardest to keep it going.
2009 Lows:
Negative emotion here too (hence unless you are a contrarian, you should probably accept the market rate of return for market risk and be done with investing) so while that cut from 3-6% on rates helps people afford roughly 40% more purchase price on a house…no one was jumping in. Also mortgage rates weren’t at their lows even though Treasury yields were as private lending was finished and even bullet proof credits had a hard road. Also, mortgage rates hit their lows much more recently and continue to sit there – no one was lending at today’s rates in 2009. Just recall that this “recovery” required the government to go “all in”. No mark-to-market for banks, no need to divest inventory, provide all kinds of incentives and get loan limits sky high because agencies (basically bankrupt) are the lenders of last resort. I can’t think of much more besides a formal foreclosure moratorium or free 20% downpayments on the tax payer. We are still working through the “All in” methodology. Certainly preferable economically to an outright global crash but clearly this is a controlled and planned market 5 years later even with all the economic firepower behind it.
Anyway – I think it’s important to consider these things as we don’t have a lot of data on housing and rate correlations on the upside and what we do have has some VERY different underlying fundamentals in those periods.
Mike, I am simply stating the fact, and I am not trying to convince anyone. Mortgage rate at 6% is historically the norm. Even today the Canadian rate and Australian mortgage rate are around 6%, and they are not getting 30 year fixed rate. Their housing price is still at bubble level, with no sign of busting. It’s true if the rate is 18%, housing price will suffer, but nobody is predicting that.
So IMHO, it’s hard to see 6% mortgage will cause housing crash. Rate is related to all asset prices, not just housing.
Slim, I buy a house to enjoy and live with many factors considered. Rate is not the major factor. I look at data, but I put more faith in common sense. I consider the building cost and the land value. Everyone is special, and I don’t generalize. But IMHO, the real bargain is rare today, but there were plenty two years ago. It’s hard to predict another crash, simply because fed reserve, treasury and all the banks around the globe are working toward a solution. Like it or not, it’s hard to fight those all together.
Reative rate drop with price drop. Reactive rate jump with price bubble mania. Nothing proactive about the rate manipulation.
@ Sadie,
“I think many owners who need to move (bought between 2000 and now) will be renting out for negative cash flow.”
Disagree. You need to differentiate those that purchased near the peak (2005 to 2008), as well as those who are paying significantly higher interest (above 6%), or some combination of.
For the others who bought 2000 to 2003, 2010 to 2012, and those paying around 4% interest, they will most likely be at positive cash flow (depending on the city / area). Their positive cash flow will be even more pronounced after 5 years into their purchase, because rental prices go up, and their loan payments are constant.
Rents don’t always go up; they normally do, but it’s not guaranteed.
Yours seems to be a unique point of view, to favour the ideas you do, together. ha ha
At least these days…
BTW: “worker participation rates”? Are you using that as a euphemism, or do you really think people are not working because they just don’t want to?
Good calls here both for DHB and J.Beckman.
just keep pumping so i can get rid of my house, almost there baby, then adios calif
It would be nice if that would happen. I’d sell in a NY minute. But what’s frustrating is that it’s too high to buy (as a hedge to the loss), but too low to sell. Quite stuck, I feel.
That’s a good way of thinking about it. Then where? Just curious.
This may be the fly in the ointment for prices rising. The overhead resistance in home prices will very likely be the break-even point for all those that have been underwater for the last 5 years and are eager to get out, if the opportunity arises. This is an inventory that the banks/govt can’t easily control with accounting changes.
But, that was the biggest housing bubble in history, so there’s a good chance we never get that far before the party stops. As I’ve postulated before, the lenders need to get involved and ease standards and I don’t think that’s in the plan this time. If rates start to rise again, then it’s really going to be difficult as meeting the monthly mortgage will once again become out of reach for many would-be buyers.
I was thinking along those lines… Seems like a catch 22?
I also wonder what the underwater holdouts will do once prices reach that breaking even point.
I’d love to know the reasons why you believe that lenders should be easing their standards.
Joe, I don’t think lenders will be easing qualifying std’s very much. Not like the sub-prime and NINA type loans. I think appraisers may ease up on the numbers as I’ve seen a touch of it lately.
Here’s a podcast interview of Sean O’toole about what’s in the near future.
http://www.tngacademy.com/mp3s/norris-radio-show.html
As prices rise and more homeowners have equity, inventory should start approaching ‘normal’ levels and put a downward pressure on housing prices.
Will some underwater homeowners automatically sell because they have equity? Sure, I’m sure some homeowners are so disillusioned by the experience they’ll try to sell no matter what.
Of course other homeowner’s might see that they’ll pay more for rent than they’re currently paying in housing expenses and stay. Rental-Parity is the key.
Cash investors have already shown where the ‘bottom’ lies. The sellers that are getting their head above water will show where the ceiling is.
7% in the stock mark means DOW 26000 in 10 years. …no way, no how.
Dude in 1990, “No way DOW about 10,000 in ten years dude.”
A 7% return includes dividends and interest, not just capital appreciation.
I wonder what will happen to these hedge fund purchases if they try to fold them into REIT’s but the returns don’t hit their target? First they pump, then they dump.
I’ve thought about this too. I wonder if their backup plan is to go long and collect the rents should the RE market dip too much before their targeted sell dates. If rents were to also drop in a plan B scenario, they might panic and trigger a sell off. Or maybe everything will be great for everyone.
LA County’s distressed inventory of 3 times the number of available listings tells the whole story. And now the Fed is openly discussing the market distortions it has created with ZIRP and what to do about it. The housing ‘rebound’ is one of those distortions….especially when considered against household incomes and historically low interest rates caused by the Fed purchases of long end Treasuries. Something will have to give at the Fed some time this year. The FHA is going to need a bailout.
Inventory hold back strategies by the banks appear to be with us a long time.
Nice summary of the situation. Also brings out the bizarre comments that government is “manipulating the market”… like there was ever a time anywhere when government didn’t have some influence on the market. The most outrageous notion is that prices are something “objective,” not just an agreement between buyers and sellers.
I have a cheap plastic digital watch. If I agree to sell it for $0.25 and you agree to buy it for that, then that’s the price. If I agree to sell it for $25,000,000 and you agree to buy it for that, then *that* is the price. If three people sell their watches for either one of those values, then that’s the appraised value.
As for the “inflation is coming to eat your children” meme… not so. Too many vulture capitalists are profiting from buying both private and public assets cheaply for inflation to be a problem now. And the bond markets agree. And even Shadowstats alternative to government figures shows no surge in inflation. The only things that have a chance to inflate are things financed (e.g. housing, college educations, etc.). For the rest of the economy…deflation.
BTW, deflation favors the creditors. If you want to look for government influence, it’s handy to remember that U.S. government is now a wholly-owned subsidiary of Citibank / Exxon.
My 2¢
I personally blame everything that is bad in my life because of the government, inflation, and fill in the blank.
I read websites that tell me so, there for it’s completely true.
Thumbs up.
I’ll buy your 2cents for 2 cents. 😉
Another thing, why is the FED Reserve so interested in Southern California in general? There are other parts of the country that they have to worry about also! Housing isn’t that great in other areas, so why would low rates be so bad? They can’t offer specific rates for individual parts of the country!
Funny, the people dooming and glooming are nothing but renters or people who got screwed.
Sorry, but the FED doesn’t revolve around those people either!
As pugtv mentioned in earlier comment the question of where is the disaster is common and I hear it all of the time.
The disaster is that price manipulation steals money from the consumer by artificially making the market higher than it is. It makes the uninformed feel good and vote for the status quo when in fact they are being looted.
There are thousands of Buyers in SoCal looking for a home and yet they cannot find one as the system is pumping homes out through the back door to Funds. Now I am all for Capitalism and free markets, but not manipulated Crony Capitalism where the free market is not allowed to engage in the process. How many people are still living in homes without making payments for years? I know two and neither have even received a notice of default.
Is it good for someone to re-fi a $400K loan on a $200K house at current rates? You may be quick to say, “Yes”, yet that is a horrible economic decision. Yes, it does keep them stabilized, but they will be peasants forever as they have to hurdle $200K just to make their first dollar in equity. If the markets worked as normal those same people could re-establish in 3 years and be back on track to stabilization and at least building some equity.
What do you think the long term moral and morale hazard will be on these loans as people see they throwing money down a hole? This prolongs suffering and sets the stage for countless people to make uninformed poor economic decisions that will destroy their long run potential.
The disaster is here and now, you just need to re-frame your view.
“Rates are the lowest they have been in a lifetime, but they have not come down as quickly as I would like. We have not seen as robust an effect as we would like to see,†(Dallas Fed Reserve Bank President) Fisher told reporters after an evening speech here.
Fisher said that in his own view, the Fed’s quantitative easing seems to be “having a lesser impact as we go through time.â€
Well, duh. Article here:
http://www.marketwatch.com/story/feds-fisher-disappointed-with-qe3-market-impact-2013-01-16
Regarding housing inventory, I was surprised to see inventory and sales decreasing in many areas. Initial impression would be inventory declines are due to sales increase. I tried to find yoy sales and compare with yoy decrease in inventory but couldnt find.
Is this decline in inventory correlated to sales or is there a question as to where the inventory is going?
It’s interesting to me how bullish everyone seems to have gotten over the past few months, heck the past few weeks. Bullish on housing, stock market, everything…keep hearing it’s time to get in, can’t lose, everybody’s back to work, everybody’s shopping…feels like 2004; wonder how long the mood will last, months, years?
I was thinking almost the exact same thing. The psychology of the market at this time seems like we’ve been in an upswing for a couple of years or more, when in reality, the upswing in prices is maybe 8 months or so. Perhaps this whole cycle will be only a couple of years?
Use the psychology to advantage; buy stocks or whatever, just get a protective put also, because the VIX is at a 5 year low right now – which tells us people *think* it can’t drop, which is usually when you want the protection the most.
2-3 years IMHO barring unforseen exogenous shock.
Interesting article from LA Times a few months ago:
“69% of homeowners with mortgages in US are at over 5% interest and unable to re-fi due to: battered credit, insufficient income, stricter lending, etc”
http://articles.latimes.com/2012/sep/18/business/la-fi-underwater-loans-20120918
There has been some talk about the possibility of downward home prices when interest rates rise (2-3 yrs from now?). I took a look at these graphs and it appears that during high interest rate periods 1960-1982, there was little little impact on the Case Shiller Index.
Link to 10 year T Note
http://finance.yahoo.com/q/bc?s=^TNX+Basic+Chart&t=my
As you can see, from 1960 to 1982 the interest rate rose from 4% to 15%.
Link to Case Schiller Index during same time:
http://www.ritholtz.com/blog/wp-content/uploads/2011/04/2011-Case-SHiller-updated.png
As you can see, from roughly 1960-1982, real home prices stayed pretty constant except for a small bump and return to normalcy between 1977-1982.
So the last time interest rates rose considerably, it did not have a material affect on real housing prices. Why would we expect real housing prices to decline if interest rates go from 3.5% today to 6% or higher in the future?
What is different today than back in 1960-1982?
If you look closely at the second chart on house prices you will see that house priced dropped significantly and quickly in the early 80’s and 90’s as a consequence of a spike in interest rates. Rates hit over 17% in 1981 and 10% in 1990 just before an over 10% DROP in real house prices. Between 2000 and 2005, mortgages were cut in half to a low of 3.5%. This was a major factor in the RISE of house prices and the bubble. However, the bubble was so massive that instead of having to raise rates to cool it down, the Fed has had to artificially lower rates to keep the country TEMPORARIALY from collapsing in a mountain of debt. Which it will eventually do.
Rates usually follow the market, with a lag. High demand for loans tends to cause a rise in the rate of interest. Whereas low demand tends to cause rates to decline.
The closest correlation I can find to rising house prices is the level of employment. As unemployment gets into the 7% level, (The way it used to be calculated) prices stabilize and start to rise and unemployment heads south. If found this by putting a long-term employment chart for CA over-layed on a median house price chart for CA. I went from 1960 to 2006. The correlation was almost exact.
“What is different today than back in 1960-1982?” Incomes were rising through this period in the US.
The ratio allowed for mortgage/monthly income was ~30%-35%. So it’s not really whether or not rates are rising so much as whether or not the rates translate into meeting this ratio threshold. If many people could afford a mortgage at 15% it’s because at 15%, the actual $ cost was still well under half of what they made in income every month.
The difference is the cause and effect. Rising rates were to control run away inflation. Housing also increased due to increase in dual income families. Cause and effect is easy to misunderstand, as it seem.
+1 or manipulate by flipping the effect to the cause side of the explanation.
Incomes.
Dr. Housing Bubble do you think now is the right time to buy in Thousand Oaks? Looking at a fixer upper 1500 square feet 500k
If you plan to work within a 30 min commute to thousand oaks… Then yes… 2011 may have been the best time because you could have asked for price cuts and for them to pay for closing costs without much competition from other buyers.
Prices could fall again if the rental market crashes… Rental parity due to low rates and lower home prices is making the market stable for now.
We lived in THOUSAND OAKS for a decade. We just bought a really nice fixer (and now it’s a beauty) in Simi. There are less illegals in Simi Valley, and I like the floor plans more. Most of TO is an overpriced slum under $600K. The demographics has changed. It’s the SFV pattern of bad stuff happening.
Our friends bought a pretty house off Arboles and their kids bikes got stolen, 10 people in a 3 bdrm home. next door. Newbury Park is no better.I use to work for The Janss Corp. It is my roots, but it isn’t worth the same dough. Just my 5C.
“What is different today than back in 1960-1982?”
Well, demographics, for one thing. Around 1982, the Boomers went into high gear transitioning into adulthood and buying homes in the millions. Now, they’re at the end game, thinking of a small apartment.
Also, the entire world economy was vastly different. We were still riding the wave of winning the war and, more importantly, escaping unscathed, unlike our competitors in Europe and the East, who were still rebuilding from the ashes. Now, China (Communist China!) is eating our lunch, and we are greatly in debt to the world.
It is clear that we do not have a normal market in L.A. This is new territory with the unusual drop in MLS supply. I do suspect the banks are selling multiple properties to investors(not open to regular home buyers) which accounts for much of the decline in available properties. The decrease in supply affects the move up trade and relocation trade. It may be easy to sell your house at a inflated price to a desperate person who needs shelter, and then in return, you become that desperate person seeking shelter. Like musical chairs. The market is strange, which causes some people to stay out of it.
Yes, why else would we see so many highly profitable flips in the face of low inventories and normal number of sales? Banks would rather see a quick hit to their balance sheet from an all-cash sales to investors as long as these homes are converted into rentals or flipped at a higher nominal price.
JohnCPA
Ca Homeowners Bill Of Rights effective Jan 01, 2013 is a big piece of the puzzle of
lack of inventory. Burns my arse.
Bulk Sales of REOs to deep pockets for rentals is another part of the puzzle, you guys are right. Carrington Mortgage (Rick Sharga, former VP of RealtyTrac) did a $450M deal as the first deal a few years back. I know some employees who blabed.
I don’t see a normal functioning housing market coming back in my lifetime. I’m 55.
I may have posted this previously, but it’s relevant to this discussion regarding relationship between home prices and incomes:
# # #
“New research from the California Budget Project examined data from the Franchise Tax Board and found that income gains during the last two decades were overwhelmingly concentrated among California’s wealthy. Between 1987 and 2009, more than one-third of the income gains went to just the top 1% of Californians, and almost three-quarters went to the top 10%. The bottom 90% received just over one-quarter of the growth in incomes.
There is a similar divide as to changes in annual income. During the last two decades, the average income for the top one-fifth of Californians jumped by more than 20%, after adjusting for inflation, while incomes declined for Californians in the bottom four-fifths of the income distribution, on average.
The report also found:
The top 1% have pulled far ahead of middle-income Californians. Over the last two decades, the average income of the top 1% of Californians increased by 50%, after adjusting for inflation, while the average income of the middle fifth fell by 15%. In 2009, the average income of the top 1% was $1.2 million — more than 30 times that of Californians in the middle fifth.
*November 23, 2011|By Alissa Anderson and Jean Ross
# # #
Conclusions:
1) Although California median income level is just a few grand over the National, since all real estate is local, these data indicate that there is plenty of people with firepower in LA to over-pay for homes
2) Data may explains why the Inland Empire completely deflated post-bubble as real incomes have been stagnant to falling
I agree with the good doctor that real estate expenses are frequently underestimated by potential investors. I have been renting an SFR for the past 4 yrs. The owner lost his local job and found another job in a city too far away to commute.
There is considerable deferred maintenance of the 1990 built boxy tract home. The exterior has not been painted since the house was built. The fascia boards will now have to be replaced because of sun & water damage. Carpet needs to be replaced, bathrooms need remodeling, dishwasher is broken, lawn sprinklers are broken and need repair. Window coverings are old and worn. The house has termites and needs to be tented.
I would estimate probably 30 – 40k in deferred maintenance. The house is about 20 yrs old now and no work whatsoever has been done since it was built. My rent is so low, however, that I’m not pushing him to do any renovations. Plus I’m not planning to be there much longer….
SoCa, I made this same point a few postings earlier. I had to rent out my condo due to a job move, and had to pay others to handle the regular maintenance costs and the unfortunate unforeseen costs as well. After two years I could see the costs starting to burn a hole in my wallet, not to mention the vast increases coming in property taxes, municpal fees, etc. In short, I couldn’t raise the rents fast enough to cover my costs in the end.
some points about the assumptions made regarding the blog post’s mention of the pasadena house for sale (and yes, it clearly looks to be by a flipper investor – how can it NOT by the evidence in the listing??)…
1. the home value 4mo’s ago was never <$300 psf (median comps) in that neighborhood;
2. @about 210psf purchase, it was clearly a distressed sale and a GREAT DISCOUNT/DEAL for the flipper investor;
3. what makes you think that median wage earners are buying up these 600k+ homes? if you take a closer look at the spread of wage earners in the area, there are the 150k+ hh income earners that are able to purchase at that price
4. i think we tend to stick to closely to the spreadsheet calcs sometimes and not consider other factors other than *median* xyz…
Leave a Reply to NotASucker