California Housing Fiscal Emergency Part Deux: California Housing and Economic Dynamics in Massive Recession.
It has been a few months since I’ve done a thorough analysis of the California housing and economic situation. Given the current changes I think it warrants another close look. The last article I did regarding California with an in depth perspective laid out 10 reasons why I thought California would not face a housing bottom until May of 2011. Since August, all of the reasons laid out in the assessment have only accelerated and thus cement the target date for a bottom.
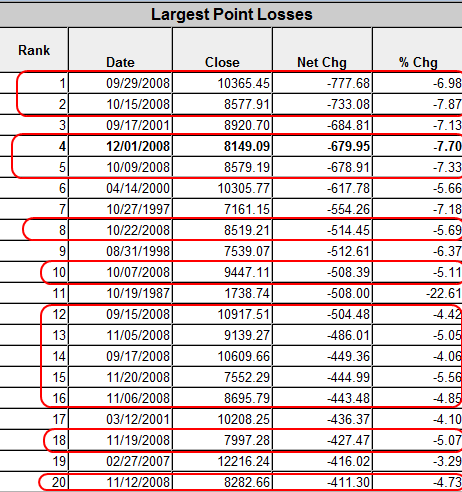
In addition, I was simply flabbergasted on Monday when the market had its 4th worst point tumble on record. In fact 13 of the 20 top point drops on the Dow Jones Industrial Average have occurred in 2008:
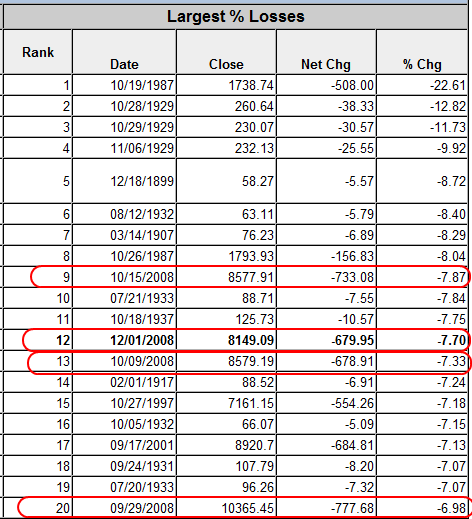
Now of course the above data may not say much given that the Dow is higher as well so it only goes with logic that the biggest point declines will happen as time goes by. But make no mistake, yesterday was the 12th biggest percent decline and that does signify a big drop:
The Dow has seen 4 of the top 20 percent declines occur in 2008. This is significant. Let us run a quick tally from the top 20 percent down days:
2008:Â Â 4
1929:Â Â 3
1987:Â Â 2
1933:Â Â 2
1932:Â Â 2
1899:Â Â 1
1907:Â Â 1
1931:Â Â 1
2001:Â Â 1
1997:Â Â 1
1937:Â Â 1
1899:Â Â 1
Out of the top 20 percent declines on the Dow, 2008 is the winner which should give you a perspective on the volatility we have been witnessing on the market. And the news for the decline yesterday was simply a statement of the most obvious. That yes, we are in fact in a recession. It was incredible that there were a large number of people in the market still believing that somehow beyond all logic and sense of reason that the market was somehow not technically in a recession. The National Bureau of Economic Research stated that we have been in a recession since December of 2007. Even though we had positive GDP growth in Q1 and Q2 of this year this was a pseudo bounce based on the Uncle Sam American Express voucher program that provided a bit of stimulus to the country. So we’ve been in a recession for a year but certainly the problems go back even further beyond that.
The Governator announced to the newly minted politicians on Monday that California is now officially in a fiscal emergency. He had called for a special session trying to resolve the issue but lame duck politicians were on “fact finding” junkets or simply playing hide the salami while Rome burned. These are the people leading our state which is the most powerful economic engine in the 50 states of the union. What an absolute disgrace. These people are getting 6-figure salaries and the only job they have is to represent the populace and they can’t seem to even get that right. Our deficit is ballooning each and every day and budget analysts are saying that we may be broke by February. I’d argue that we are already broke but to many debt is the same as wealth. Today, a group of Governors including Arnold are meeting with President-elect Obama for what I would imagine should be a fascinating spectacle of who can hold out the largest tin-can.
The state budget deficit is gigantic. To first understand this mess, you have to follow the money:
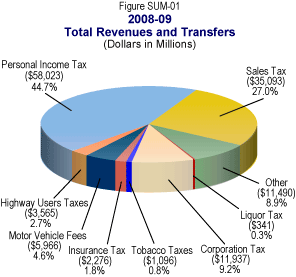
Keep in mind these are estimates. A state as large as California with expenses over $100 billion is no small thing. But anyone can quickly look at the above pie chart and understand we are in serious trouble. The two biggest sources of revenue for the state are personal income tax and sales tax. These 2 areas make up 71% of all revenue sources. Well, you can already see the problem arising here. First, as much as people want to believe that Black Friday was somehow going to resurrect the economy one day does not make a trend. People are not spending as much and subsequently sales tax revenues are going to shock us on the downside. In terms of the personal income tax, well you can pretty much kiss a large portion of that goodbye. High paying bubble jobs like real estate agents, mortgage brokers, financial analysts, construction workers, car salesmen, and others in the FIRE economy are no longer going to be paying Uncle Arnold their chunk of gravy train day salary. The personal income tax damage will be obvious come Q1 and Q2 of 2009.
In addition, those that have no job are literally paying zero into this pot and we are having more and more fall into this category especially here in California that now has the 3rd highest unemployment rate in the nation:
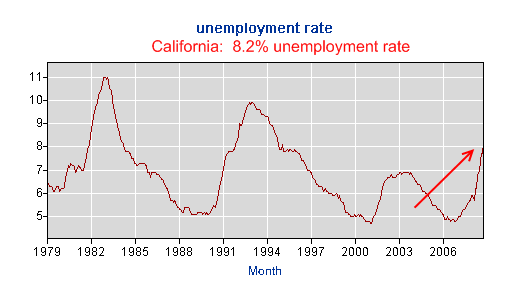
You can expect this number to shoot up even further. JP Morgan recently announced that they’ll be slashing 19,000 WaMu employees, many in Seattle but California has the largest number of retail money spigots which I’m sure will see their cuts. I remember walking into a WaMu once and a mortgage broker/lender/financial analyst/life guru wanted to sign me up for a pay Option ARM because the cheap payments were “awesome” and I’d love it.
So the repercussions are going to be fierce, long, and severe. These folks also aren’t consuming. Some of the biggest consumers of urban tanks, granite countertops, and all other things that carry heavy sales tax price tags were people in the bubble economy. Guess what? They are taking a double hit to the two biggest items of revenues for California, personal income tax and sales tax. You may think there aren’t many agents or brokers in California but I suggest you look at this graph:
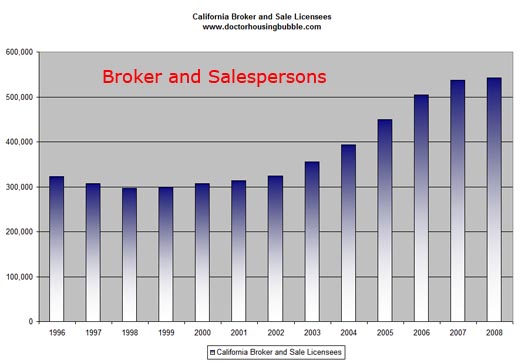
Now you tell me, what industries are going to absorb these folks? Even if they get positions in retail, that is a big cut in their paycheck. The government isn’t hiring as much because guess what, we are flat broke! Our politicians are going to be forced to grow a spine here. You have some puritans on both sides. Some say “we’ll never raise taxes” yet don’t give ideas on how to solve the economic problems of the state because if they do slash, they’ll simply create longer lines of the unemployed. Others say, “raise taxes on everyone” yet fail to realize that there isn’t much taxes to raise now that people are getting hammered. There has to be a balanced approach and this will simply help us through the period. There is no easy way out of this folks. A decade of financial decadence is coming home with a very expensive bill. Maybe we’ll think about instituting a constitutional amendment that when times are good, the state be forced to collect extra money and set it aside for financial emergencies like the one we are currently facing. But politics isn’t exactly a logical business. You would think that the best time to raise taxes is when everyone is fat and pigging out at the easy money buffet. Instead, regulations disappear and crony capitalism takes a hold of the entire economy and we spend every nickel that comes in.
In addition, many of these people will need to be retrained for new jobs and public colleges are cutting back on enrollments or raising fees. Another whammy on this group. The few industries that are still hiring like engineering, healthcare, and accounting require a specific skill set. This isn’t like taking an online video course and getting your DRE real estate license in one week. Even to become a nurse, you’ll have to go to a community college full-time for 18 to 24 months.
California is the heart of darkness when it comes to this economic disaster. We had the highest priced real estate and the largest number of highly paid bubble blowers benefitting from a once in a lifetime gig. It is like hitting 10 blackjacks in a row. At a certain point, you start thinking that you have control over the game until you bust 15 times in a row. Let us look at the county with the largest population in California, Los Angeles to see exactly what is transpiring.
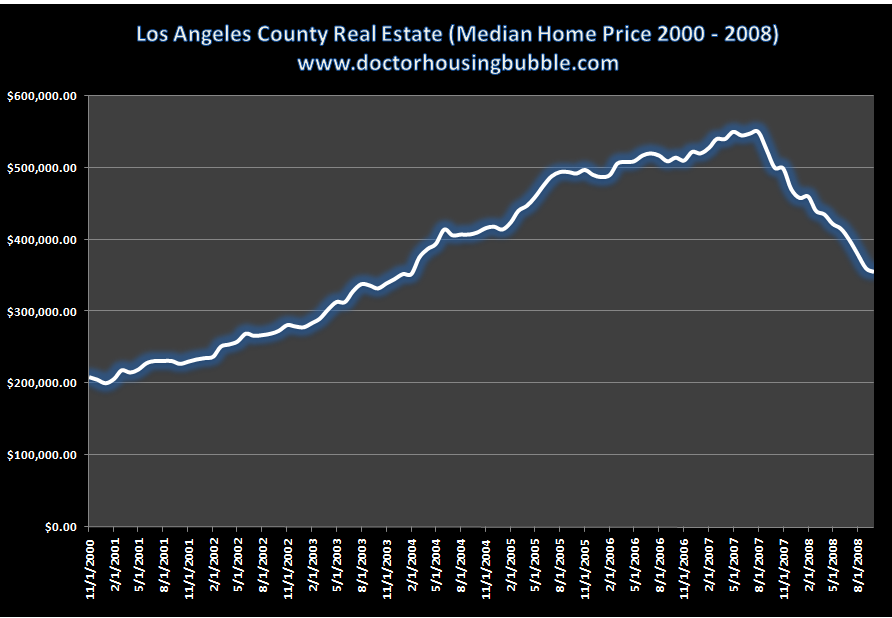
Los Angeles County has 88 cities and 10,000,000 people call the place home. In terms of diversity, Los Angeles is it. You have extremely prime areas like Beverly Hills and Santa Monica and other areas on the other side of the spectrum like Compton or Lynwood. Yet during the bubble even non-prime areas saw outrageous price increases mostly fueled by subprime or toxic lending pushed by greedy lenders who were puppets for Wall Street and blinded by their own ambition. Let us look at the Los Angeles median home price over this time:
*Click for sharper image
The L.A. median home price topped out at $550,000 in August of 2007. I know that it seems like a lot longer ago but only a year ago, were we sitting at the mountaintop. Now, the median home price for the county is $355,000. A drop of nearly $200,000 in one year. How would you feel if you bought at that $550,000 peak and now knew your home was only able to fetch $355,000 (if that) on the open market? I can tell you how many are feeling. Many are simply walking away from their homes. When I say walking away I don’t mean that they leave on their first miss payment. In fact, idiotic legislation like SB 1137 simply kicks the shiny empty Coke can down the road a few more months and allows many people to stay rent free in a home they clearly cannot afford. They will walk in droves next year. I’ve talked with a few contacts in the industry and they are telling me that if you have a 720 credit score and 25% down you can get a loan at 5.25% up to $725,000. Yet the traffic is not there. Why? Because how many people today have $181,000 sitting around for a down payment on a home? Also, you have to have debt-to-income ratios that keep you under 37% so let us take that $725,000 home and run the numbers:
Down payment:Â Â Â Â Â Â Â Â Â Â Â Â Â Â Â Â Â Â Â Â Â Â $181,000
Mortgage 30-year fixed (5.25%):Â Â Â Â Â Â Â Â $3,003 (Principal and Interest)
Taxes and Insurance:Â Â $755
Total monthly payment (PITI):Â Â Â Â Â Â Â Â Â Â Â $3,758
Needed net monthly income:Â $10,156
You will need a monthly net income of $10,156 to afford this home even after putting $181,000 down if we want to keep the 37% DTI ratio with net income. Yes, you’ll have tax deductions but keep in mind that monthly nut of $3,758 comes out of your monthly cash flow stream. You reap the rewards when you do your taxes. But let us not get caught up in missing the bigger picture. There is such a tiny amount of people in California that fall within this range that it is comical. That is why sales have fallen. People are missing the point. It is all about income and jobs. It always was about this. If the median U.S. income was $100,000 I assure you we wouldn’t be having this discussion. But the fact of the matter is the median income is only $46,000.
Many are now losing even that median income job. That’ll depress wages and home prices further. And California had this incestuous relationship with housing. That is, many of the high paying jobs simply existed as a leech to the bubble. Now that the host is gone the vector can no longer survive in the current ecological system. That is simply a fact.
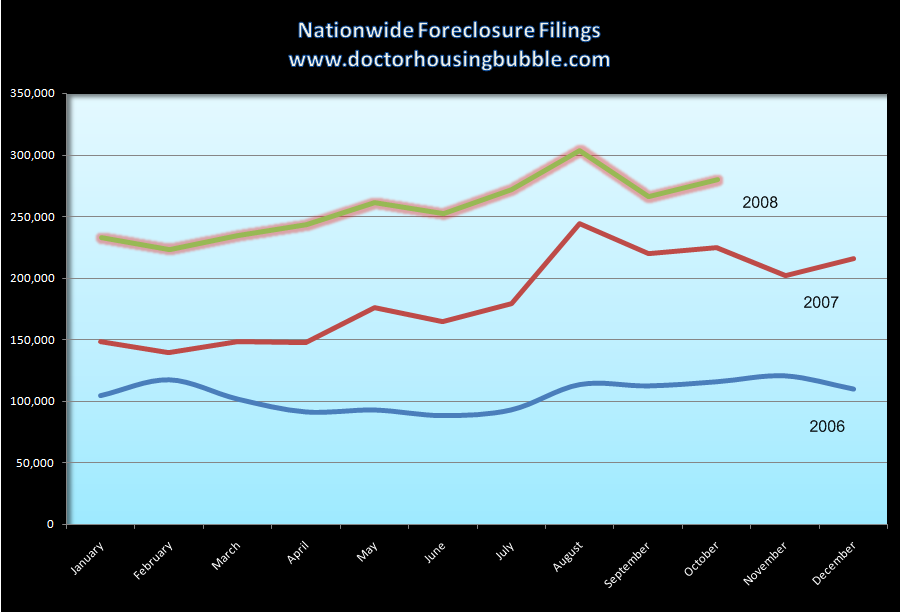
Even with all these foreclosure moratoriums and hackneyed responses to the bubble, the foreclosure rate is still through the roof:
*Click for sharper image
When this year comes to a close, 2008 will have the highest number of foreclosures we have ever seen. Take a look at the above chart. This chart includes bailouts, the Hope Now Alliance which I actually called up 1 year ago, foreclosure moratoriums, Ben Bernanke dropping rates like there was no tomorrow, and every other gimmick in the world. Yet foreclosures are still at record highs. The reason all the programs have failed is because they don’t explore the household income side of the equation. So long as the unemployment rate keeps increasing, we shouldn’t even begin to discuss a bottom. And even when it levels out, we should take a deep look at the jobs that are growing. The last thing we want is what happened in 2000 when nearly 30 percent of all job growth happened in the finance, insurance, and real estate economy.
California is at the epicenter of all this. In fact, California alone made up over 20% of all nationwide foreclosure activity last month. And this is including every gimmick you can imagine. Just wait until Q1 and Q2 of 2009. That is when the tsunami of pay option ARMs will recast, plus we’ll have the SB 1137 zombies coming to life, and finally the grim tax revenues that unless we have a 100% stock market run up, is certainly going to show us a very poor state indeed.
 Did You Enjoy The Post? Subscribe to Dr. Housing Bubble’s Blog to get updated housing commentary, analysis, and information.

 Subscribe to feed


28 Responses to “California Housing Fiscal Emergency Part Deux: California Housing and Economic Dynamics in Massive Recession.”
Thanks DHB. What do you expect to happen in 2009 when the tsunami of pay option ARMs recast and the SB 1137 zombies come to life. Do you think we will start seeing some firesale prices finally?
Thanks DHB,
Your posts are soo informative, and refreshingly honest, unlike the positive spin that most media are TRYING to put on things.
I, as well, feel that 2009 will be the year reality sinks in for soo many people. No jobs, no homes, no credit cards to pay for groceries with…
Everybody keeps saying we’re at the bottom, we’re at the bottom, but it’s just wishful thinking or downright deception.
We actually just stepped off the cliff and will be falling for some time to come.
Thanks for your insights. Keep it up.
SJ
Another excellent post as always. Thanks. Your work is much appreciated.
Can anyone tell me what the hell the Nationwide Foreclosure Filings chart is supposed to be showing me? What do each of the 3 colored lines refer to?
Arrogance is at the heart of the matter. I’m a programmer and see things as yes, no, if, else, quantity, time. I don’t understand voodoo economics built on hopes and dreams. The concern now, as in the Depression, is that people are losing faith in our entire way of life. We will get through this in some shape or form, but future generations will again be arrogant and that somehow they can defy reality by closing their eyes, clicking their heels and repeating “there’s no investment like home…”
I can’t understand that chart at all. There’s no legend to it! How about putting what the plot lines are associated with at the bottom of the chart?
Props Dr HB, the truth kicks-assz!!!
I’ve herniated my groaning muscle. Good grief.
~
So how is it that California still harbors so many ultra rich people and overpriced houses? Coz the middle’s falling to the bottom, that’s how.
~
The Fox Street Journal had a chart that left me limp and gaping:
http://online.wsj.com/public/resources/documents/st_DEFICIT_20081201.html
~
Doc suggested setting aside rainy day funds. Washington State’s governor (Chris Gregoire) did this in 2004 when elected. She was lambasted for it. Somehow WA isn’t showing up on that list of states in serious trouble. There are cutbacks in the planning, yes–deep ones. But all through the ’04-’08 bubble she kept insisting that the state prepare for a downturn. Needless to say her biggest adversaries have been the building industry. They’ve tried twice to unseat her.
~
As for the foreclosure filings chart, what’s the confusion? The X axis is # of foreclosures, the Y axis is per month, and the three lines are labeled 2006, 2007 and 2008. It shows that for each year, foreclosures have gotten higher and higher. If you like, imagine these three lines strung end to end on a chart that’s three times as wide. The point of segmenting and comparing the yearly segments is to show just how vast this increase in foreclosures is, YOY.
~
rose
Phil and JH
The graph makes sense. Look at the bottom line labelled 2006. Find the point above the vertical lower line marked August. Trace back across to the left to the horizontal axis. That point of the graph shows around 110,000 foreclosures in 8/06.
Now do the same thing for the line above it marked 2007. It will show around 240,000 -250,000 foreclosures in 8/07. Repeat the process for the line marked 2008 and it will show around 305,000+/- foreclosures in 8/08.
The graph shows foreclosures in 8/06 at 110,000 that month; in 8/07 around 240,000 that month; and over 300,000 foreclosures in the month of 8/08. Ergo the foreclosure rate in 8/07 went up over 2.18 times that of 8/06; and the foreclosure rate of 8/08 was 1.266 times that of 8/07 and 2.76 times that of 8/06.
Thank you Doctor. I read your posts religiously. Truly, I wish that you, or people like you, were running the country instead of the greedheads.
This is interesting.
I wonder how this is going to affect places like CT . I know places in MA and RI have seen hard times. But it looks like the devil is in CA.
Jobs and wages worry me more. We are not creating real jobs, with livable wages and solid foundations. Skrew Real Estate, I can’t invest in them unless people have money to pay rents. If they don’t, then I AM IN DANGER of loosing my property. I cant start a business unless people have money to buy stuff. Heck, maybe I could start a school teaching ppl to be self sufficient? LOL , what good I’ll that do.
Everyone’s new years resolutions should be to learn how to plant a garden and make their own clothing.
It’s-a-good-time-to-buy-a-house!
And-more-stock!
The-bottom-is-definately-in(this-time)!
I have my very basic budget online here http://spreadsheets.google.com/ccc?key=pGy0BQU1PZ9DR33mmqkdSdA if you have a google acct, you can copy it to your own account and play with the numbers.
Bottom line: if you live frugally (as my wife and I do), make $10k/mo and have a 37% DTI mortgage, you’re only saving ~10% of your income. I truly believe there are major problems with the DTI above 32% (and even thats high IMO). With a lower income, 28% is tight with the price of groceries and health insurance in particular.
As an aside – anyone notice how prices went up due to fuel costs, but nothing has come down yet due to fuel? Maybe airlines are the sole exception there..
Takes a lot longer than 2 years to becomes an RN… Most schools have 7 or 8 years worth of students on the waiting list.
Well at least in Florida they’re finding a solution:
http://michellemalkin.com/2008/12/02/terrific-law-breaking-activist-helps-homeless-break-into-foreclosed-houses/
Thank you Doctor for another brilliant post.
I don’t however see the problem.
The wise men and women we elected can just crank up the printing press as they have done for the banks, the populace in general, and the auto industry (as long as those nasty CEO’s quit flying in those little planes).
First, to make a complete picture you should also include the graph of the expenses, along with the revenues. It will become clear that the state spends more than it takes. If a family does that, it files for bankruptcy. But the state of California, because of its liberal politicians (who buy votes) has been spending beyond its means.
Second, you mention the taxes (revenues) – either increase or decrease. The other side of the equation is the spending (expenses) which is out of control. But nobody dares to talk about cutting the expenses. Tragic. But that’s how the state is being destroyed. Thank you liberal.s
Your best article yet. Great job, and thanks!
I wonder what the real unemployment rate is when comparing the methodology employed in 1982 to today? Thanks again for your great work.
http://www.shadowstats.com/alternate_data
I am no fan of Calif. legislators. However, they are unable to stand up and suggest cutting spending for one reason: They become targets of public employee unions. Politicians who dare to question any spending by school districts are targeted by teacher unions to be defeated at the next election.
These unions will use ANY tactic availiable- when the school teachers in this city struck, they used 5 and 6 year old children on the picket lines!! Children have no concept of political battles, but it did not stop the unions from having cute little kids on the news saying:”Give my teacher a 10% raise.” No politico who wants to get re-elected can stand up to these tactics.
Thank you for your article. Can you imagine being the King of handing out mortgage loans between 2000 and 2007 and if you were actually loaning your own money and could not package your mortgages to Fannie Mae, Freddie Mac and Wall Street.
May I see your tax returns? May I see your pay stubs? May I see your bank accounts? How much are you putting down? Nothing. Ok, nothing down, tax returns show 43,000 a year and you want to borrow 550000 (the average cost of a home in California).
You see that door. Dont let it hit you on the head on the way out. Next customer! I will tell you what is going to happen and it does not take a crystal ball to figure it out. Look at Doctor’s graphs.
Prices will drift back to 2000 levels at best. The run-up in Real Estate from 2001 through 2007 will be just a dream or for some a very real nightmare.
The problem right now is that every bank, mortgage lender is finally acting as if they are loaning their own money just like they did a long time ago.
The problem with “rainy day funds” is anytime the government shows a surplus, conservative tax activists show up and declare that this means people are being overcharged. That’s what happened to Washington’s rainy day fund. People decided they’d rather get “refunds” from the government than let it keep that money to spend in the next recession.
How will homeowner mortgage bailout program work?
http://money.cnn.com/2008/12/02/real_estate/Bair_on_bailouts/index.htm
If the bailout program really works, there will be way less foreclosure, and will home price get stabilized?
Outstanding post.
I agree, it is all about jobs. Please check out Mike’s link to ShadowStats.com; it’s a very provocative website and, in my opinion deserving of a link. An article (originally published in Harper’s) that gives a little more context to William’s work can be read here: http://tampabay.com/news/article473596.ece. Start throwing those numbers around with the trade deficits and the unfunded federal entitlement programs and it gets scary real fast.
You mostly focus on the housing market but I hope that in a future post you address the numerous underfunded pension funds. It’s a nasty problem that will put a lot of hurt on some vulnerable folks.
Haha, this post is like the drums in the mines of Moria — “doom, doom, doom, doom.” California is a sitting duck, just like the greedy dwarves who dug too deep, and I for one cannot *wait* till the goblins come.
Dr. HB. Yet, another epic blast ! If only people could climb out of their denial and see the facts that, you present so clearly.
1) Bubble Over
2) Prices dropping like a rock
3) Jobs disappearing
4) Incomes dropping
5) People not spending
6) Banks not lending
7) People going broke
8) State going broke
9) Auto Companies going broke
10) Huge Financial Corporations going broke
11) U.S. Govt going broke
12) Record Foreclosures
13) Record Housing Inventory
14) Upcoming Loan Resets.for Alt-A & Prime in 2009…etc..etc…
15) Oh, I almost forgot, the Govt declares that maybe. we have been in a recession. since 2007.
What really disturbs me though is ,your line graph on LA County Housing from 2000-2008. Take a look at the change in slope, once housing peaked. It accelerates to the downside much steeper than the upside. If you extend it out, we should be at $a median price of 200,000 by the end of 2009. Two other points about that graph.
1) The housing boom realy started back in 1997, so we probaly need to roll it back 3 years
and
2) Real Estate Busts usually overshoot to the downside. So where might that take us? $150,000 ???
What amazes me is, how people can be so myopic and believe these “macroeffects” won’t have an effect on their city, zip code, area or block. Why, because it’s different there. They will be the ones who suffer the most. Remember ,the last dominoes to fall usually fall the hardest in real estate.
http://www.westsideremeltdown.blogspot.com
“People are missing the point. It is all about income and jobs. It always was about this.”
Right on the money as usual DHB. Housing prices are a function of income, not the other way around despite the foolishness of the last 10 years. Median income has not risen in recent years and therefore the value of the median home has not risen. The prices of the median home rose for the last 10 years in los angeles, but it was only because of foolish loans and specu-vesting. The home values have ultimately remained the same as have incomes. In other words, take away the crazy mortages and crazy real estate and Wall Street investors and we will be right back to 1997 in terms of prices.
And then you may want to go one step further perhaps and take all of the real-estate mania incomes that are quickly drying up out of the median income equation (real estate brokers, mortgage brokers-how’s Countrywide doin?, construction-how’s KB doin?, crown molding/Italian marble/pergo floor sellers-how’s Home Depot donin?, stainless steel appliance/flat screen sellers-how’s Circuit City/Best Buy doin?, new car/Hummer sellers-how is the automotive industry doin?. Take these out and you may perhaps see that median income has actually declined…which may mean that home values have actually fallen. And at the end of the day, home prices will fall, and they will perhaps fall beyond 2000 levels and even beyond 1997 levels. We borrowed our way out of a couple of recessions, and now it’s time to pay up. Now…what was that everyone was saying about real estate only going up?!
Nice list. #14 Planet of the Alt-Apes could be the worst. Unfortunately, the trade wars will start soon. We’ve lost at least 2M jogs this year and look out below. They say they know how to keep this from turning into a depression, but they still thing that all they gotta do is print more money a spread it like a crop duster. The surgeons don’t understand the problem, so everything they amputate will make the problem worse down the road.
Leave a Reply