
Who Moved my $11 Trillion? How to Lose $11 Trillion in One Year: Housing Market Collapsing, Stocks Crashing, and Comrade Economics.
I know what you are thinking, “thank goodness for that $810 billion bailout!” $10 trillion is the new million comrades.  As we blasted through the $10 trillion mark with our national debt, we have also managed to destroy $11 trillion in “wealth” in one year by simply looking at two measures, the residential U.S. real estate market and the Dow Jones Wilshire 5000. Keep in mind we are only going to look at these two measures in this article. This does not include other global markets that are outperforming us on the downside making any decoupling theorist update their resumes. Who knows, with a track record like that they may land a job at CNBC.
As the world central bankers used their T-Mobile Sidekicks to text message one another, the markets had other bad intentions:
 “Big B. 2day w3 hook up 4 mjr mrkt action.”
 “Word. Drop the FFR. Ttyl Trichet.”
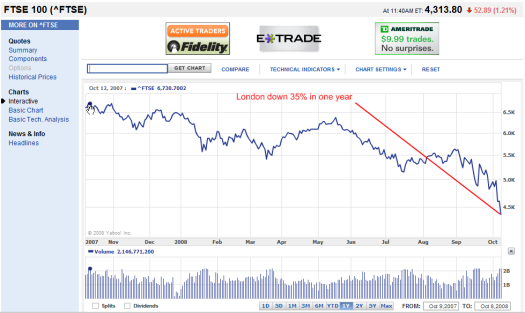
What is the point of dropping the rate when people are flat broke? This is the problem when people do not understand what mainstream America is battling with. If you watch many news stations they forget that nearly 50% of households have no 401(k) since they cannot afford one to begin with! Yet they operate under the impression that everyone is gambling in the world casino market. Normally, a major Fed cut would have a major or at least positive impact on the market.  Now, it is like spitting into the ocean. Earlier this week, I posted an article that compared the velocity of the 1929 crash to our current market. We have now surpassed the velocity of the crash during the Great Depression! From the peak in September of 1929 to September of 1930 the DOW was down 36%. From the peak in October 2007 to October 2008 we are now down 39%! But aren’t you glad that we are not officially in a recession? Otherwise things would really be bad.
No matter how you slice the market whether you look at the NASDAQ, DOW, or S & P 500 they are all getting hammered without prejudice. Can you believe that I heard some blowhard trying to blame this on the sub-prime market? Bwahahaha! Yes, let us blame poor people for crashing the most sophisticated global markets by buying inner city homes at overvalued prices. Give me a freaking break. The sub-prime problems now seem like a welcomed distraction in comparison to the credit market freeze, the credit default swap market, and now the consumerist global markets slamming on the breaks. You know why the global markets are crashing? Because people turned markets into Ponzi schemes of global proportions. Now that we have to reconcile reality with values their simply isn’t a correlation. That is why paying face value for mortgages is absurd. These places are going to fail anyway. Why give money to these criminals?
You want a novel idea? How about we raid the bank and investment accounts of CEOs complicit in this credit casino and use any money we find to fund loan workouts? We need to get this passed ASAP since those investment accounts they have are taking a beating so we want to make sure we liquidate right now in case the market goes any lower. If we wait any longer, their account might look like the 401(k) statement of many Americans. Can you believe that one contention in the bailout bill is about how much money we should give CEOs? Are you kidding? We should be talking about how much time they are going to get in the slammer not the size of their golden parachute.
Wilshire 5000 Â Â Â
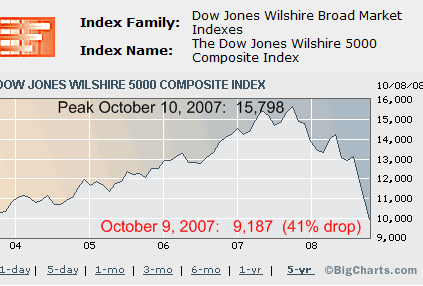
The Dow Jones Wilshire 5000 is probably one of the best snapshots of the overall U.S. equities market since it covers over 5,000 securities. Most of the time when you hear about people talking about the “overall” market losing X billion this is what they are referring to. Since the index itself doesn’t publish up to date market cap information, I had to reconstruct a few data points:
Peak Reached on October 10, 2007:Â 15,798
52-week low October 9, 2008:Â Â Â Â Â Â Â Â Â Â 9,187
With that said, the index is weighted so it tries to reflect price changes as accurately as possible. Of course given the nature of stocks and the size of the index, we only get a rough ball park. On March 24, 2000 the index hit 14,751 and represented a market value of $14.7 trillion. Keep in mind this was before the tech bubble popped and many tech stocks are in this index as well. So with that, we can construct a proportional equation to arrive at an approximation of the peak price:
(14,751 / $14.7 T)Â X (15,798 / Market Cap?)
So we’re solving for the market cap at the peak. With that we get the following:
23,223 / 14,751 = $15.7 Trillion Market Cap at peak
Okay, so now we have a very rough estimate at the peak market cap for a sizeable portion of the U.S. equity markets. Now we have to calculate the percentage loss. From the peak hit last October the entire index is now down, 41.8%. So with that, we can calculate the market cap that is now lost into the great abyss in the worldwide casino:
$15.7 trillion x 41.8% = $6.5 trillion in market cap gone in one year
Now we are not calculating the global beat downs that are occurring. Let us just take a quick look to see how others are doing:
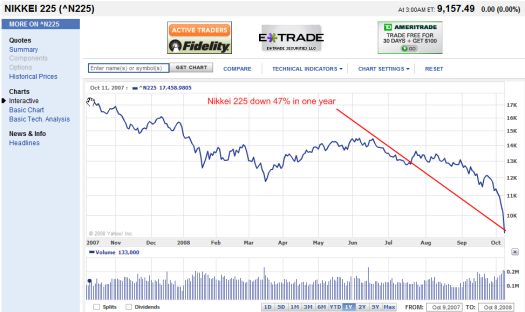
*Chart Update:Â Add an additional 9.62% to the downside.
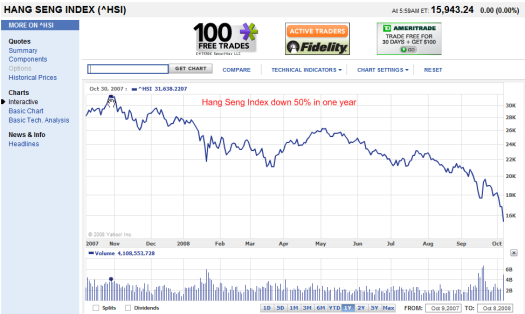
*Chart Update:Â Add additional 8 to 9% decline to the downside to chart.
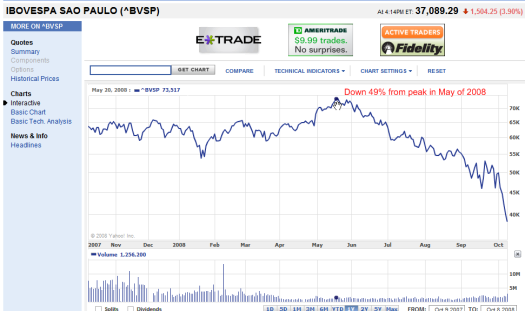
In relation to the above, we aren’t doing so bad incredibly. Yet if you need any further proof you can examine the Russian stock market and other markets and you’ll find similar patterns.
Case-Shiller Index and Housing Loss
The most widely followed and trusted housing measure in terms of housing percent increases and declines is the Case-Shiller Index. Most tend to view this as the most accurate measure of overall price declines since it looks at the same home over time which tends to give a better feel of how the market is performing. Given that the index only looks at 20 large metro areas, it does not cover the entire country. However, since most people live in these areas it does reflect a good measure of the housing market like the Dow Jones Wilshire 5000 does for stocks. Let us look at the chart:
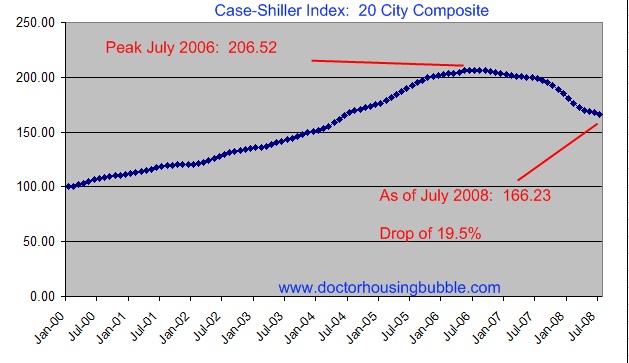
The peak was reached on July of 2006 at 206.52. You need to remember that for the baseline year 2000, the number is set at 100. The 206.52 represents a doubling in price over 6 years. The most current data figure is that of July 2008 and puts us at 166.23, a loss of 19.5% from the peak. Similar to the above, we approximate a loss from the peak. At the peak, it was estimated that the United States residential real estate market was valued at $24 trillion. With that we can estimate the current amount of equity that has evaporated:
$24 trillion x 19.5% = $4.68 trillion in housing equity gone
So in a little over one year, Americans have seen:
$6.5 + $4.68 = $11.18 trillion in wealth disappear
Just to put that into perspective, the dot-com bubble burst was estimated to wipe out $5 trillion in market value of technology companies from March 2000 to October of 2002. Keep in mind many people are estimating that we will see a national housing price decline of 30% before this is said and done. If that is the case, we will see an additional $2.52 trillion housing equity that will evaporate before we hit bottom.
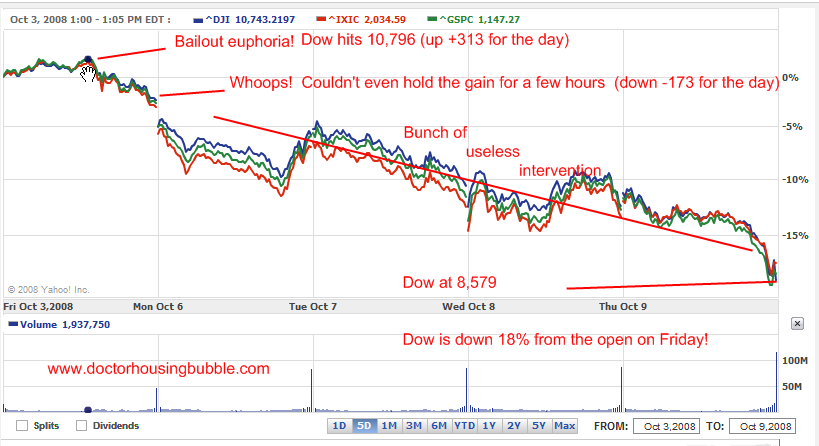
That is why the $700 billion for buying up bad assets makes no sense whatsoever. All this is going to do is help support a few lenders and given that $11.18 trillion is already gone, what is that going to do in the larger picture? If they really want to help, that money should be used for job creation in sustainable fields or science and research development for this country. At least we’ll get something from that instead we are going to flush it down the toilet. You want to see how the market responded to the bailout visually?
*Click to enlarge
The Dow is now down nearly 18% from the market open on Friday October 3 when the bill was passed. Comrades, this is not the way to run a free market. If we are going to be giving money out we might as well use it for the greater common good. After all, $1 trillion ain’t what it used to be.
 Did You Enjoy The Post? Subscribe to Dr. Housing Bubble’s Blog to get updated housing commentary, analysis, and information.
 Subscribe to feed


22 Responses to “Who Moved my $11 Trillion? How to Lose $11 Trillion in One Year: Housing Market Collapsing, Stocks Crashing, and Comrade Economics.”
Thank you Doctor for another enlightening post. The dollar continues to build strength as does gold. Oil is in the tank along with housing. Where oh where does one put their stipend to keep it from the hands of our greedy politicians?
Dr HB, The velocity is truly staggering here. People need to stop and look at the trends here. We are in UNPRECEDENTED territory now. The old models don’t apply. A drastic overhaul, triage, or whatever you want to call it is neccessary. At least the hope of new leadership gives us a chance.
The real estate market and the American Consumer will take the brunt of this mess. As financial companies are being “re-valued” so will all other financial assets. Including real estate. People will no longer stay in denial as their net worths are decimated.
Big Time Drops are in store for the most affluent neighborhoods. Especially, in areas that experienced the biggest appreciation over the bubble years (2000-2007). The Westside of Los Angeles will see impressive price declines by the end of next summer (2009).
http://www.westsideremeltdown.blogspot.com
Dr.
Do you think that the dollar could collapse? Schiff seems to think so. Could we go the way of Iceland, or are there too many countries depending on us to let us fail? Should I move my meager savings to Swiss francs?
You said that we’ve fallen father than the Dow fell during the Depression. In September 1929 the Dow topped out at 386.10. In June 1932 it bottomed at 42.84 for a total crash of 89%. To match that today, the Dow would need to drop to 1570.80. We’ve got a long way to go to match the Depression.
So what happens when the Option ARMs start re-setting their interest rates in earnest?
This is going to have to be a bottom up recovery. The “average” household is going to have to become more solvent. We (the U.S.A.), are going to have to re-learn how to build things, grow things, fix things, and be patient. I guess with our addiction to credit, this will be a “twelve step” process. We have to get over the idea that everyone should go to College, we need to re-emphasize the trades, American’s will have to go back to doing the jobs that “American;s just wont do”.
How about voting the entire Congress out? Ahhhh~~~ dreaming is still legal, isn’t it? 🙂
Hey Dr. Bubble,
You need to recheck your stats on the Great Depression. It went from 380 to 44 from 1929 to 1932. That is a 90% decrease in price in less than three years. We aren’t that much faster, but we’re definitely keeping pace.
Dejnov.
Comrades,
What I was referring to with the Great Depression is the VELOCITY of the drop, not the actual bottom which hit 3 years later. I’m using the peak from September of 1929 to September of 1930 and comparing that to our peak in October of 2007 and October 2008. Given the market today, we are going to shatter that.
I think Schiff made a mistake since he was encouraging investing in foreign countries which has a touch of decoupling. Clearly we are not decoupling. We are going through uncharted waters here. He was right on other things including the collapse but this is a global collapse, not just U.S. Look at oil. Countries like Russia and Brazil were bringing in big money when oil was $140+ but now oil is at $80. We are talking about a 45% drop from the peak in a matter of months.
So there are many variables working here. What about option ARMs? The bulk don’t even reset until next year. The credit markets are flat out frozen because no one has any trust. And I hear people say it is “fear” but there is legitimate trust issues here. Would you trust what some of these firms have on their books? That is where the markets are.
Great Depression vs Today graph:
http://spreadsheets.google.com/pub?key=pGy0BQU1PZ9AYrZgFwaFWHQ&oid=2&output=image
I threw that together from Yahoo’s historical data. Basically, I took the data and did %change for each day. Then I found the high before the depression (381.17 on 9/3/29) and put in our high (14164.53 on 10/9/07).
Blue & Red = Dow in Great Depression converted to our numbers today (starting with our high, and then losing/gaining x% daily). It ends at the bottom of the depression.
Yellow = Actual true numbers as of yesterday.
Gotcha on the Dow. Then you have a typo in your article because in the article you say from Sept 1929 to Sept 1939.
phantom wealth? search derivatives, c.d.swaps., books
Carter, ‘what if the (b)ooomers can’t retire?” the ‘wealth was never there.”
Well the values of houses (and stock) is only worth what it’s perceived value is.
And to be honest housing prices had gotten to ridiculous proportions in many large cities.
And a lot people were looking at 25 year mortgage monthly payments being smaller then rent values and thinking they could live the dream.
When it may have been in all honesty out of their means.
The drop in house values is nothing more then a change in people’s perceptions.
A house is only worth what someone is willing (or able) to pay.
As for the interest reduction, ya its too little too late.
But this is the price we pay for such a long boom period that preceded all this.
If we can believe in the threat that the global “Communist Menace” and spend fifty years and trillions of dollars to combat it, is it so far-fetched to hypothesize that the uber-rich want to stay that way?
If we can believe that there currently is a “clash of civilizations” between the west and the Muslim world, and that entire philosophies of destruction being have emerged that feed only on their follower’s “hatred of our freedoms,” is it so outlandish to believe that the most powerful people alive desire to rule the World, just as all the powerful people have desired throughout history?
Is it really so hard to believe it is happening right now to us?
http://yourmortgageoryourlife.wordpress.com/2008/09/22/conspiracies-and-headlines-whats-the-difference/
http://www.newyorkfed.org/mortgagemaps/
Hey, if y’all wanna get a wee bit of a peak into what is ahead, just look at the numbers on this page!
Mo’ money! Mo’ Money! Mo’ Money! all disappearing down the drain.
I do not like how in the text-message conversation Bernanke is addressed as “Big B.” That is my own (extremely) professional handle and I do not want to be associated with this noxious toad in any way. Thank you.
Dollar strengthening? That’s only because the other currencies are falling faster and the dogma is that the dollar is a safe haven. Rather than panic and use all our resources to fight the wrong fight, we indeed need to let the market sort this out to some extent. If we get through this, we need to have some concept of developing a sustainable economic system. Letting the insane run the asylum is never a good plan. Regulations evolve just to prevent this exact thing from happening. In capitalism, the one who breaks the rules wins unless there are some repercussions. The tinkle-down theory has always failed. The world is complex, but the important principles don’t change. It’s not different this time–just we are far more ill-prepared to deal with this depression, but we will find a way.
I agree with Doc that the DJW5000 is one of the better indexes…but, DHB, the front page of the NYT, CNN, USA Today, Barron’s, and other sources most people see report only the DJIA…which is 30 “blue chip” stocks.
~
Just as the GDP has been continually redefined to count whatever is going up, the DJIA has as well. Stocks are added and subtracted.
~
For example, on the 18th of last month AIG was removed from the index, “leaving [it] underweighted in financials.” You know, since financials were no longer frothing up the DJIA:
http://biz.yahoo.com/ts/080918/10438174.html?.v=2
~
At the time Kraft–the holding company for makers of cheap crap-meals-in-a-box, mystery meats, and, ferchrissakes TACO BELL–was going up. So they put Kraft in.
~
The DJIA at present:
~
3M
Alcoa
AmEx (F)
AT&T (T)
BoA (F)
Boeing
Caterpillar
Chevron
Citi (F)
Coca-Cola (C)
Disney (E)
DuPont
ExxonMobil
GE
GM
HP (T)
Home Depot (C)
Intel (T)
IBM (T)
J&J (C/D)
JPM Chase (F)
Kraft (C)
McDonald’s (C)
Merck (D)
MS (T)
Pfizer (D)
P&G (C)
United Technologies
Verizon (T)
Walmart (C)
~
C=Consumer D=Drugs E=Entertainment F=Financial T=Tech
~
This is what they’re all shrieking about! These 30 stocks. Out of some 10,000.
~
Looks to me like there are only 9 actual industrials in the Dow Jones Industrial Average (30 percent). The other 70 percent is mostly speculation, consumption, and the Complexity and Acceleration Industry, rather than hard assets.
~
Talk about phantom wealth–DISNEY? And blue boner pills. And cheap crap from PRC labor camps. And gut-ballast that makes people fat, sick, and stupid. And of the actual industrials what do most of them produce? Global warming, nuclear war, suburbanization, and things that explode. And beer cans.
~
One graph now:
http://upload.wikimedia.org/wikipedia/commons/1/17/DJIA_historical_graph.svg
~
Look at the amount/mass of purple above the 5,000 line to the right and below it to the left. Does a return to 5,000 or even less still seem unthinkable? THAT’S WHERE IT WAS BEFORE THE TECH BUBBLE! Just 10 years ago. I’ve been seeing the bottom at 7600-8100. But 5,000 wouldn’t surprise me in the least.
~
Isn’t this actually pricing these companies at appropriate rates as the unsustainable crapness most of them are–casino tokens that for awhile now have been as overvalued as Real Homes of Genius?
~
rose
~
PS–Bernanke isn’t a toad, he’s a crony capitalist. Let’s PLEASE get in the habit of naming these vermin for what they are–the ugliest species on earth. I can’t believe that people still consider sex acts or organs, or animals, to be the worst we can call each other. I mean, Hank Paulson makes Ebola virus look merciful. Bernanke is an economist, and that’s the second worst thing you can call anyone. After investment banker.
~
There’s an old Savo-Karjalan saying, “If shit was worth anything, bankers would steal our assholes.”
You make it simple and clear, great web page. The printing press is going 24/7 and they are going to inflate. History repeats itself, try to buy a 2 buy 4 today at what is cost a few years ago, a house will never go to zero, and you can’t depreciate stocks. The bottom is near. Put your ear to the track.
Hey Doc, I just have to once again send a big THANK YOU for your great work… keeping up with extremely high quality posts, and this great service that you are providing to the country through your website. You are always spot on. You are providing sanity, reality, and a bit of much appreciated humor on the huge events which are re-defining So Cal, the country, and the world. Thank you, thank you, thank you… and please keep up the great work!
i think if you multiply the total US residential stock by the average price – you will find it is substantially more than the #24 trillion you suggest,
At 2.6 people per household with a population of 305 million (refer Census data) that indicates 117.3 million owned and rented occupied units plus around 10 million other / holiday homes 0 with a peak bubble average (not median) price of about $US330,000. In total about $US41 trillion – $US3 trillion other / holiday – net $US38 trillion owned / rented usally occupied.
In taking an adjusted perspective (noting Case Shiller convers 20 urban markets only) with the NAR data as well – it would appear that nationally residental values have fallen about 15% since the peak – or about $US6 trillion with about another $US6 trillion to go,
It would appear that nearly half the $US6 trillion loss to date has been in California – with its around 13 million usually occupied residences.
May I suggest Dr Housing Bubbles you recheck the figures – and work off the base of the number of residential units and the average prices.
I look forward to yours and readers further comments……………
WOW!!!!!!! here we are a year later. i have a new golden ret puppy, a year old now, and he has two new friends that come into my garage to STEAL his food. one is a opossum we call alan, and the other is a racoon we call barry. ill bet if they could talk, they would LIE too.
Leave a Reply