The Comprehensive State of the U.S. Housing Market: Learning to Love the Housing Data and Forgetting the Economic Facts. Everything you wanted to know about U.S. Housing Trends.
America has built a large part of its economy on homeownership. Owning a home is part of the ever more elusive American Dream. Yet over time, owning a home became a larger and larger burden as new buyers were required to take on bigger debt loads merely to buy a basic home. Incomes weren’t rising so debt was the new subsidy. The apex of the bubble was reached in 2005 although prices didn’t start falling in drastic fashion for a couple years later. The U.S. Treasury and Federal Reserve are largely to blame for inciting the biggest housing bubble the world has come to know. Wall Street is equally to blame for creating the structure that allowed this to happen as they championed de-regulation and completely neglected any fiscal responsibility.
In today’s article, I will dissect the housing market from every angle. It is easy to get caught up in the day to day data but the bigger picture is usually missed. Let us first look at the total number of housing units in the U.S.:
129,000,000 Housing Units in U.S.
Owner-occupied, rented, and vacant units
In the United States we have approximately 129,000,000 housing units. These are made up of owner-occupied, rented, and vacant units. The largest of these three categories is the owner-occupied category and most of the media focuses on this number. Yet the other categories carry as much weight in determining a housing recovery. Let us look at the vacant housing units:
The vacancy rate for both owner-occupied and rental properties is still near all time highs. With so many sales, how can it be that this number is so high? I’ll get into this later in the article. But part of this has to do with demographics, the makeup of current housing inventory, and years of over building. It is also the case that we are shifting a large number of would be renters into homes and causing the rental vacancy rate to spike. Many of these apartment projects are financed with commercial real estate loans and the Federal Reserve is essentially shifting defaults from residential loans to commercial loans. That is why we are seeing rents fall as owners compete to fill vacant units.
So now we have the universe of housing units including vacant units. Let us drill down and examine the number of owner-occupied homes and renter-occupied units:
75 million Americans own their home. The homeownership rate is derived from only looking at occupied units. That is why it is important to also keep in mind the vacant units sitting on the market.
You’ll notice that the ownership rate does not factor in the vacant units. The vacancy rate is at historical highs and this is another factor that will drag on the housing market for years to come. 37 million Americans rent their housing. This can be apartments or actual detached homes. The number of renters has recently increased as homeownership has fallen:
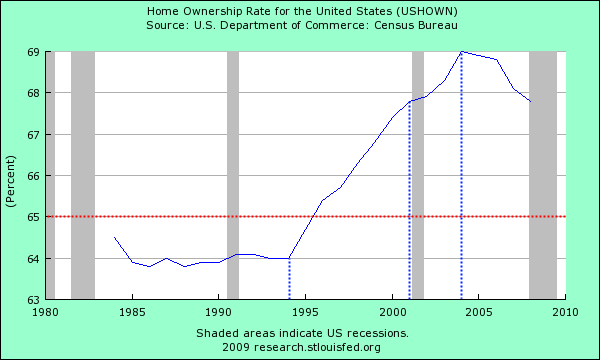
The chart has a few patterns worth noting. From 1985 to 1995 the homeownership rate in the U.S. hovered around 64 percent. The only recession during this time was in the early 1990s yet the rate remained steady. The first spike started after 1995. This trend went from 1995 to 2000 and pushed the homeownership rate from 64 to above 67 percent. Part of this had to do with the technology bubble and the growth in the economy. But then we hit the early 2000s recession largely brought on by the burst of the technology bubble. Instead of homeownership declining which is typical in recessions, the homeownership rate expanded upward. Much of this was due to Federal Reserve Chairman Alan Greenspan dropping the Fed funds rate to record lows. Wall Street looking for the new-new thing, went from tech IPOs to mortgage backed securities and the toxic mortgage party started.
This easy access to credit and excessive risk pushed the homeownership rate to nearly 70 percent in 2005. But that was it. The bubble burst and the homeownership rate is now on a steady decline. While the above chart is moving lower, one chart is moving higher. The U.S. home vacancy rate:
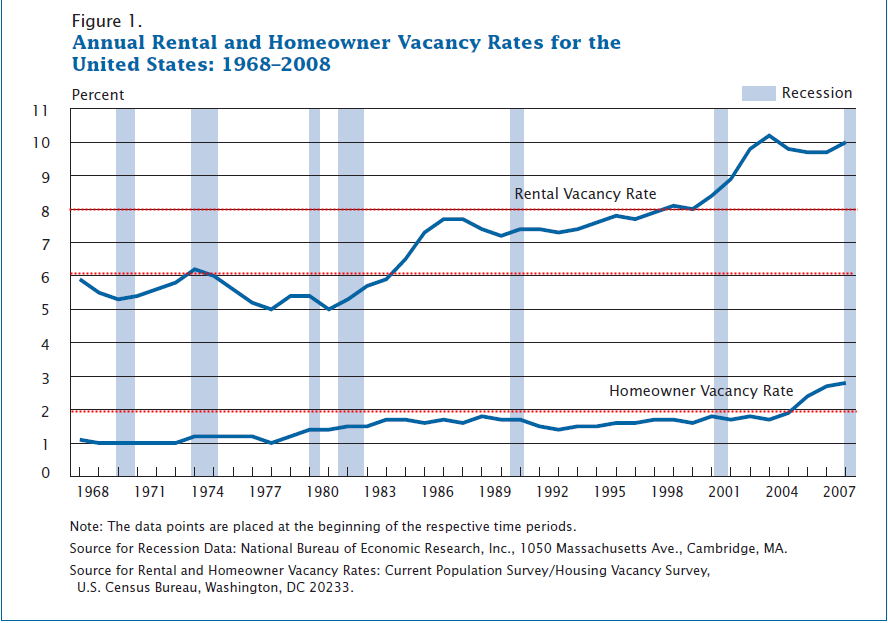
Rental properties always have higher vacancy rates merely by the nature of their use. Someone renting a home is more likely to move than say someone who buys a home and plans to stay in their home for many years. Yet the above chart shows an unmistakable pattern. The rental vacancy rate from 1968 to 1984 hovered between 5 and 6 percent. From 1985 to 1999, it was in a range of 6 to 8 percent. And finally, from 2000 to our present situation it went from 8 percent to 10 percent. This is historically as high as it has gone. You will notice that the rental vacancy rate dipped after the peak in 2005 since many people opted for rental units instead of buying a home. Yet the pattern is still holding steady.
Now looking at the homeowner vacancy rate shows another story. Too much building. From 1968 to 2004, the rate never crossed the 2 percent mark. Now, we are closing in on 3 percent. That rate may not be reached now that the market is shifting gears. But if we do have another foreclosure wave, 3 percent is possible. What happened here? Too much building and ignoring demographic trends:
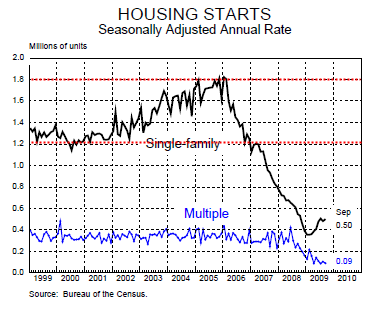
From 2001 to 2006 home building was off the charts. Single-family housing starts were up to a seasonally adjusted rate of 1.8 million a year even though population growth did not warrant this amount of new inventory. From 1999 to 2001 the rate was hovering around 1.2 million. So 600,000 properties were being added each year above the normal trend and this lasted for 6 years. Of course, this number has collapsed at a pace not seen since the Great Depression but why did it occur? People ignored the trend and demographics:
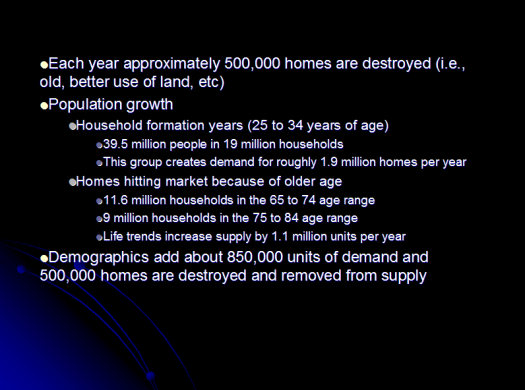
The above data exemplifies the housing bubble. Each year roughly 500,000 homes are destroyed for a variety of reasons. This of course isn’t discussed in the mainstream media but it helps to figure out a more accurate figure of what is going on. Most households will buy their first home in the 25 to 34 years age group creating a demand of 1.9 million homes. We also have homes hitting the market because of the other side of the age equation. We have 11.6 million households in the 65 to 74 age range and 9 million in the 75 to 84 age range. Life trend dynamics (i.e,. death and downsizing) add 1.1 million units per year to the market. In other words, here is the breakdown:
Now this data is using trends up to the end of 2008. We were burning through 350,000 excess units per year at the end of 2008. Of course, housing starts have now collapsed and are adding new units at an annual rate of 500,000 homes. So a significant indicator of returning to a healthy market is more linked to the actual vacancy rate. In fact, adding up the units we have about 3 million too many units on the market over historical trends. Depending on our current burn rate, we have:
3 million / 350,000 = 8.5 years
3 million / 850,000 = 3.5 years
And this is the time it will take at current rates to get to a more normal market if there is such a thing. Yet the 850,000 figure is too optimistic because we now have a new factor in the mix in the sales data. Foreclosures:
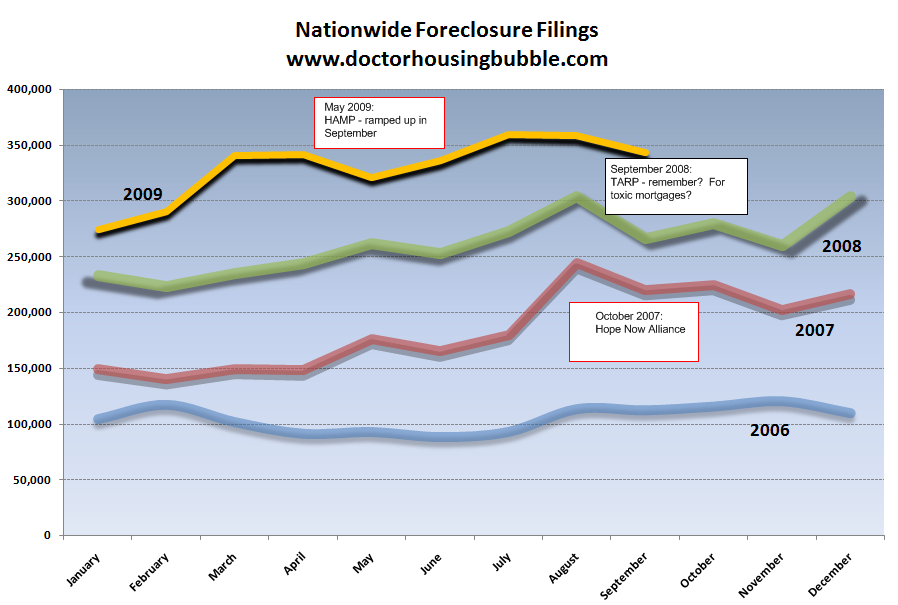
For the past year, each month over 300,000 homes enter some stage of foreclosure. This is either a notice of default, a scheduled auction, or a home going back to the bank as an REO. This number actually increases the length of time before we reach a stable housing market. As you can see from the chart above, the rate is still at a record. Now why is this the case? Think of the dynamics of a healthy market. Those in the household formation age, sell a home and in many cases will buy a move up home. This can be a new home or an existing home. Either way, they are clearing some of the vacant inventory off the market with typically two transactions taking place (buy and sell). With foreclosures, it is normally a one and done deal. Someone loses their home, and the person buying that home is merely taking over inventory that has already been accounted for. This is why looking at foreclosure figures is so important. Even in 2006 foreclosures were elevated. If you consider that year as normal, foreclosure starts should range around 100,000 per month. We are solidly over 300,000.
We still have many more foreclosures coming down the pipeline with Alt-A and option ARMs hitting significant recast dates. This will only make it harder for us to clear that massive amount of excess inventory just sitting on the market. With nearly one-third of homes sold nationwide as foreclosure re-sales, the excess inventory is sure to linger for a very long time. Take a look at existing home sale data:
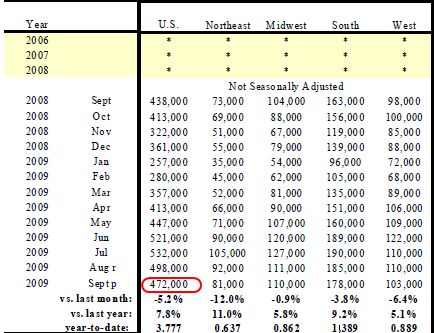
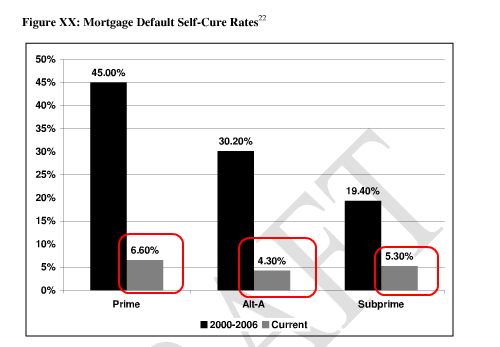
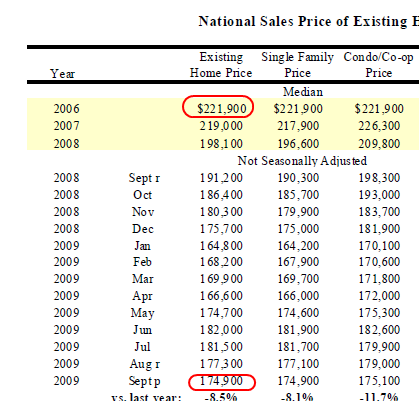
I’m taking the non-seasonally adjusted rate because with historical foreclosure rates, looking at typical data really does little in answering the real question of where we are going. In September 472,000 existing homes sold. Add in about 40,000 new homes sold and you are looking at 512,000 total home sales. However, in the same month 343,000 homes entered into some stage of foreclosure. Forget the data on HAMP for the moment since the 650,000 or so pre-trial loan mods means very little, the actual cure rates are extremely low:
We’ll be optimistic and use the 6.6% figure. That means, of those 343,000 foreclosure starts 321,000 units are going to be additional inventory. So even with 512,000 homes minus the 321,000 added units, we are not burning off excess inventory in any significant number. And that is why the vacancy rate is still jumping and homeownership rates are falling.
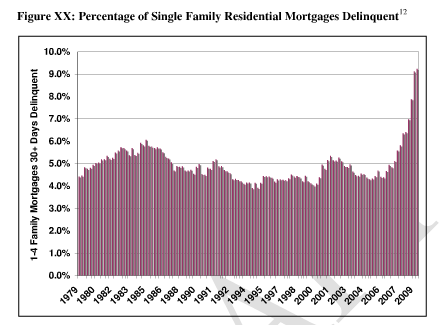
It also doesn’t help that mortgages are delinquent at a rate never before seen (aside from the Great Depression):
Over 9 percent of all mortgage holders are now delinquent on their mortgages. Of the 75 million homeowners 51 million have mortgages. So that means as things stand today, close to 5 million mortgage holders are delinquent on their loans. Since we are not seeing this in the REO data, this must mean the following:
(a)Â 30+ days late and no notice of default
(b) 90+ days late and a notice of default (reflects in monthly foreclosure data) – or 90+ days late and no action at all
(c)Â Auction scheduled
(d) HAMP – 650,000 in pre-trial
Yet the cure rate is at 6 percent and this is for prime loans. We know that we have Alt-A and option ARMs coming due in the next few months and none of these qualify for HAMP. Wells Fargo announced that they are converting over $100 billion in Pick-A-Pay option ARMs to interest only loans but who really knows if this will even help. Already for the option ARM universe, some 45% of option ARM borrowers are 30+ days late.
Conclusion
What can we gather from the above data? Home prices are falling even though data in the short-term might state otherwise. This is due to artificial inventory figures because of mortgage moratoriums and banks not moving on distressed homes in a typical fashion. There is an enormous amount of overhang in the market. Using typical measures the data doesn’t show up but does show up in shadow inventory data. The reason home sales have increased recently is because prices have collapsed:
Why are we to assume that if prices go up, people will keep on buying? The driving force right now is affordability brought on by:
-Large number of foreclosure re-sales (nationwide about one-third of all sales, in California it was up to 50 percent of all sales)
-Government programs including the $8,000 tax credit
-Federal Reserve buying GSE MBS – no one else is buying them
-Artificially lowering mortgage rates (hovering around 5% while 40 year average is closer to 9%)
With all the above, we are merely treading water. What we can gather from the above is we have years to work through this. Also, the growing number of baby boomers shifting into retirement will also add to the additional housing units at a higher pace since those in the 25 to 34 years of age group are no longer having families in large size. Many may opt to rent for much longer since some are delaying having kids until later in life. In other words, the trend is not conducive to the McMansion world.
There are many factors to consider in the current housing market and it is my hope that this article helps to show the bigger picture of what is going on. This is how I learned to stop worrying and love the housing bubble.
 Did You Enjoy The Post? Subscribe to Dr. Housing Bubble’s Blog to get updated housing commentary, analysis, and information.



 Subscribe to feed


33 Responses to “The Comprehensive State of the U.S. Housing Market: Learning to Love the Housing Data and Forgetting the Economic Facts. Everything you wanted to know about U.S. Housing Trends.”
Thank you Dr. for pointing the blame where it needs to be. I’m patiently waiting for the “moral” and “ethical” crusaders to now comment on how you are wrong and the blame is on the 1000’s of homeowners now losing their homes.
Just reading the comments here and seeing how deceived our people have become, how hard their hearts have become, and how they are almost totally manipulated by the media (controlled by the government), banksters, Wall St., and the elected representatives of the U.S.
Anyone ever look at the cabinet members of Obama and see how many are members of the Trilateral Commission, Bilderberg, or the Council on Foreign Relations?
Keep sleeping……..
Excellent article. It would seem that rather than the deceptive pap we get from “respected” souces like CNBC and the network evening news neither the economy nor the housing market is recovering at all. I agree with your calculations that just to put in a bottom and begin true recovery it will probably take 8-10 years. Welcome to the American version of what Japan has been going through since 1990.
IGNORANCE IS BLISS!!!
If the good Dr. would please stop pouring the cold water of reality over our heads, we could get back to walking around like Zombies.
As Alfred E. Neuman was fond of saying, “What, me worry?”
I really fail to understand why the government feels it necessary to prop up housing prices? We had affordable and stable housing prices (with some localized bubbles) from 1950 to the mid 1990s and that didn’t seem to have an adverse effect on our economy. Yet now everyone seems hellbent on making homes appreciate again rather than letting them go to where they should be. I completely fail at understanding why saddling people with huge debts is good for the economy. Huge debt does not equal innovation and in fact probably greatly deters it. It only servers the banks allowing them to suck as much money out of the economy as possible without providing any real benefit. Let the people who took terrible loans have their bad credit and let the banks who made them fail.
Swiller,
Does the word sacrosanct mean anything to you?
This website was a big part of why I decided to sell my house this year. The bubble is working its way upward toward the $500,000 to $1,000,000 range and those in that range can look forward to 10 to 30% drops over the next 2-4 years. When I read what Wells Fargo and Fannie Mae are doing with their “rent” schemes, my jaw dropped. Talk about delaying the inevitable.
I have a tendency to believe all the hype claiming that everything will be fine, just fine. It is economic unreality at its finest. Thank you so much for keeping me grounded!
Everquest…best game ever. Miss those days something terrible, even with me being a drunken fool more oft than not. DG, for some reason I’m thinking you might be “Uineal”?
And I 100% agree with you. The banks should take back the homes. No one should be living for free beyond what the LAW currently states. Let the banks fail, and THEN have the government take them over when they are bankrupt. Housing prices would fall precipitously in So. Cal. (which is needed so badly for those of us who live and work here). This would allow all the people who did the CORRECT thing (waiting until they can afford a 30 year standard loan) to get a house for its REAL value.
But the banks know this will be their demise, and they are NOT honorable, they will not commit Harikiri. Instead, they lean on their brethren in political office to use OUR money to keep them solvent. I’m not voting democrat OR republican until this changes.
Thanks again for breaking it down and doing the research for others to see. Knowledge is power. Also, there’s an interesting editorial in the LA Times today about changing perceptions of “Homeownership”. If only people would take the time to read, it would present a clearer picture of what’s really happening.
Westside is in for another leg down I’m afraid.
http://www.westsideremeltdown.blogspot.com
Bobby Max, congrats on selling your home. I tell all my friends to sell their homes before it’s too late, but they are all in DENIAL.
~
Good Dr., considering the govt & banking manipulation of interest rates, foreclosure moratoriums, buying all the GSE MBS, mark to market, and shadow inventory, will you adjust your prediction for a housing bottom in CA past 2011?
~
It’s obvious we are now in a govt bubble and once this one pops, there will be no one to back stop the private industry. This will be when you see home prices drop significantly even in the mid-to-high tiers of housing. Problem is no one knows when this bubble will pop.
~
Keep up the good work!
I’ve also asked myself why the govt is so determined to keep housing prices high and have come to the conclusion that it has very little to do with ‘helping’ homeowners. Rather, housing is the foundation holding up a multi-trillion dollar derivatives market. Homeowners start walking in droves and the entire house of cards collapses taking the financial system and all the major banks with it.
Swiller nov 11 GETS IT! thats why the bugle boy needs all those czars. and im curious, where does the term “HOME OWNERSHIP” come. ya dont own anything when making payments. all a house was, was a way to milk more cash and make bigger payments, dealing with handshaking vermin. ive been renting for the last 12 years since i let the x have the house. now her and her unemployed fry cook husband are in their asses, upside down, with a ratted out foreclosed on house. lost money on the quick claim, but im not counting the days till the sheriff comes with the u-haul. life is good!
I too am eager to to hear the view of the moral and ethical crusaders. You know, the ones who pump their levity cred and foresight for living a life of prudency while renting, though at the same time badgering DHB in the comments section for advice on when to get into the game. “Oh, please Dr. When should I buy?”
I find it interesting that 1/3 of homeowners have no mortgage. These are the smart folks, as they will never be underwater. Debt is the problem, LBYM and don’t buy what you can’t afford. I told my neighbors that I would rather be the richest person in a modest neighborhood, than the poorest person in a wealthy neighborhood.
“Bobby Max, congrats on selling your home. I tell all my friends to sell their homes before it’s too late, but they are all in DENIAL”
Do you tell your friends to then “buy” another home?
If so, then the home they will buy will also drop in price.
Unless they plan to sell their home and then rent for several years. But for how long?
Right now we have to sell our home. We own it outright.
We will buy another home, roughly the same price as we sell this for.
If we stayed in this house the value will go down. The next house we buy, the value will also go down by probably the same amount (in the same area)
It’s all a “wash” if you own your home and sell it, and then pay the same amount for your next home. In either case, the price will decrease, probably by a similar amount.
Ah Swiller, see…the thing is, you got it all wrong. We’re not taking the blame away from the banksters and the government. We blame them as much as we blame you. The only people I personally feel sympathy for are those who were living within their means but lost their job and have been unemployed for so long that tey are being forced to make hard decisions such as giving up their homes. I have tons of sympathy for them, and I’m even OK with my tax money being used to help them out. You? Not so much.
Banks are not eager to start foreclosures because it would cause them to be insolvent. And that’s why govt is also allowing the delay tactics. Taking back the properties would ruin the system. There’s just too many. Reverse leverage.
The persistant unemployment we are seeing will probably drive the delinquency rate from 9% to 11% by mid 2010. Sooner or later the diminishing cash flow will start to cripple the holders of these loans. Not marking to market is an accounting tactic, not getting the mortgage payment will hit the operating income squarely in the crotch.
I’m noticing rents coming down in almost all markets in CA. 10% to 15% in the last 6 months.
Dear Dr Housing Bubble,
Thank you for your contribution above to this important debate. However I strongly disagree with your views on the root causes of these bubble problems and have responded with an article “Housing Bubbles: Americans ignoring reality?” which is available with a simple Google Search.
You will note in reading this article, that in New Zealand and Australia the important public conversation is far more advanced than it is currently in America. There is real political progress in these countries in dealing with these destructive housing bubbles.
Yours sincerely
Hugh Pavletich
Performance Urban Planning
Christchurch
New Zealand
Two things I never seen talked about with the housing collapse that would be an interesting read. First of all, with the excess inventory who is going to be available to buy houses. With all the foreclosures, that is 7 years before people who actually owned homes will have it off their credit reports and even be able to buy a home. Most I would assume would not even consider it. Then add in jobless rate of people who do not qualify for loans.
The other thing I dont see, is all the realtors or loan originators who were “business owners” who cant make a living now. IE they are out of work but dont qualify for unemployment.
I can report one homeowner (NJ) who had an interest only mortgage at 5%, plus a second mortgage, totaling over $650; monthly payments were about $3625. He applied for a mortgage adjustment and was given a 40 year 3.25% mortgage on his principal loan but no change on the second. He’s now paying about $715 less each month but is still way underwater and pouring money into a black hole; he’s considering a move.
RCharles
Brilliantly written.
Thanks!
I can not believe the stupidity of our Government!
They have purposely spent trillions to reflate the bubble and are having great success in screwing the taxpayer so far.
The houses that are selling in the areas I am looking are now selling for near peak pricing, going by what zillow says they were worth in 2005 and what they sold for now. In fact, one house is now ABOVE, yes above what it sold in 2005 by 70K!! It is true they spent some money on a crappy remodel (it was a good laugh) but it didn’t look like that much money.
Think about it, if low interest rates caused housing bubble 1, what are the chances of housing bubble 2 with even lower rates? It too is destined to collapse, BUT WHEN?
Can the Fed hold rates at zero forever? Sadly the answer appears to be……long enough for it to be forever for me.
I refuse to spend 600K on a dump. I will move to the bowels of hell (Phoenix) before I do that.
I sold a house in a prime area in late 2004 and so far it was the worst decision of my life.
Regarding the increasing vacancy rate – I wish they told us where those homes were located. You will note, vacancies have been increasing pretty consistently since 1977. If this vacancy chart were determinative of price, one would incorrectly conclude that housing prices have been trending down for 30+ years now – which is clearly not the case.
I assume much of the vacancy rate is related to huge swaths of the rust belt where the population is about 1/2 that of the 1950s – its the only way this national data makes sense. Does anyone know if there are stats that break down the vacancy rates more by area???
Martin-
It’s all about AREA! AREA! AREA! I was very fortunate to move out of a corporate-packaged housing development last year and lost only 50K! I bought in an area that is predominately Asian almost one year ago and currently, I can sell it for a small gain. The important aspect here is that I feel safe in a neighborhood surrounded by cash buyers. Whose going to foreclose here? If you live in an area that has a public school system where API’s are well over 900, I doubt housing will drop much, if at all. Numerous buyers here are dumping their cheap, cheap, cheap, US dollars and and snapping up select properties around the state, CASH! Waiting for select properties to drop in this state is like waiting to buy a house in San Marino for 500K. You are just tormenting yourself. The Doc is probably correct on 98% of the properties though out the state.
DG,
Our elite consensus decided a long time ago that the US was going to dominate the world in Finance, Insurance and Real Estate. They were afraid of foreign competition in every other arena, which is why our universities pump out people who are good for nothing but social work – you can’t outsource child protective services to India, at least not yet.
If you look at the growth of the economy in the last 10 years, it was mostly in the financial sector. Now that it blew up in everyone’s faces we are back to where we were in 2000 in real income terms.
Our status as world reserve currency and the resulting strong dollar has a lot to do with it. Our elites can import luxuries and travel on the cheap, we import everything, foreigners take these dollars and invest in Wall Street, driving up asset prices to unsustainable levels, rather than buying things we make.
The only way out of this is to end the deficits – trade and budget. It will be painful. We will probably have to close many bases overseas and demobilize the armed forces into a more defensive posture. We’ll have to pay more for danish blue cheese and beemers. We’ll have to increase manufacturing capacity which can hurt our local environments. Or we can do nothing until something breaks.
I feel fortunate that I grew up in a home where a discussion about “greed” occurred rather frequently, and that I had parents who used what money they had wisely. I learned at my father’s knee what good spending principles are. He’s passed on now, but the same principles apply and will continue to apply. Buy ONLY what you can afford (no loan because you then are dancing to the bank) and save what you can. They were children of the last Great Depression.
If I were looking at real estate now, I’d be thinking buy remotely, and sit tight. Otherwise, RENT.
Undoubtably its going to collapse. And yes, its going to be severe. At this point, despite what we do, its going to break. And break big.
Dr. Housing Bubble:
Maybe I’m missing something, but the math of the net change seems to be off by 1 million units
1 Million – 500,000 + 850,000 = 350,000 units
But mathematically, isn’t it 1 Million – 500,000 + 850,000 = 1,350,000 (or 1,850,000 – 500,000 = 1,350,000)? Or did I confuse something?
Thanks for your posts.
Swiller,
Think this. Pretty funny randomly running into you on a board about housing. Made the biggest mistake of my life buying into the bubble with an idiot loan and now my credit is paying the price. If only I had been born 4-5 years earlier this all could have been avoided. I may be an idiot, but I don’t think I would have bought into the piggy machine phenomenon. If another bubble comes by the time I can buy again I’m leaving SoCal.
The government just extended the 8k tax credit and expanded it by offering 6,500 to those who are not first time buyers. The government bought $1 trillion in MBS and banks are doing nothing about nonperforming loans. This has created the perfect formula for low supply and high demand. The tricks are working.
It is clear that the government is doing everything in their power to keep the market afloat. What makes you think they will stop? This will all be on the backs of your children and future generations.
It will be too detrimental to banks and economy to let the market fall. It will be years before we go below trendline. The government is letting the air out gently and succeeding.
The years waiting for prices to come down will be spent renting. Either way, you are paying for a roof over your head.
Frustrated Renter
Frustrated…they’ll succeed until the wheels come off. That happens at an inflection point of too much fiat money in circulation. They’ve been very careful not to ‘print real dollars’ …the bucks are actually ones/zeros on computer screens…not much extra real paper.With the HIGH U6 rate they’ll have to let real cash into the system soon or it’s curtains for the donks at the polls. When they do, inflation takes off and its curtains for the donks at the polls.
Karl Rove, you magnificent bastard!
torabora – if we have inflation, wouldn’t the price of homes rise? I’m thinking that’ll be the ultimate success for the government. They’re stalling the foreclosures and sales until they can get inflation in gear. Then the price of homes will go back up. This drives me crazy!
Hi Baffen, yes life is full of strange twisty turns. I have my own story as well, I tied to do the right thing and now am close to losing the 20% down I have accumulated through the course of owning and improving two other homes over the last 15 years.
You should go to a site called loan safe . org there are 1000’s of people struggling to come up with the right answer…either to walk, get a modification, or continue barreling down the path of bankruptcy. Some of the more unfortunate and less intelligent will fall victim and end up on the streets instead of planning to move and saving while the inevitable happens.
Life is still good though, and there is a lot to be thankful for.
Whoops, I posted this question in the wrong area. So, I ask again – Where is this “High Desert” area at the top of the first chart. (I’m from New Yawk).
And, thanks for all the hard work.
Leave a Reply to DG