Real Homes of Genius All-Star Edition: Today we Salute you Compton. Investigating 3 Blocks of Housing Bubble History and Hundreds of Thousands of Dollars Lost.
Much was made on Tuesday that the Case-Shiller Index showed a positive increase for the first time in many years. This of course was for nationwide data and did not take into account seasonal adjustments. However, there is noticeable change going on. Yet the Los Angeles and Orange County data point was still trending lower. Not exactly good news as we look into the exotic mortgage zoo with our Alt-A and option ARM waste. On Monday, the big jump in home sales was led by the median price dropping by $13,000 but the media was spinning this as some kind of sign that housing bubble version 2.0 is around the corner.
I’m surprised how quickly some people are capitulating and thinking that somehow the market has suddenly turned around. Didn’t our Governor just sign a budget to patch up the biggest deficit in the history of California? The disconnect is amazing. One simple question people fail to answer is what jobs are going to replace the 6,500,000 jobs lost since the start of the recession? Keep in mind many of the lost jobs were good paying jobs. Here in California, you had many people especially in the mid to upper priced areas buying overpriced homes with over sized incomes because of the bubble. You had mortgage brokers, agents, bankers, and others connected to the housing industry that believed in the housing bubble and paid top dollar for a bubble home. Unfortunately, they are facing a double-whammy with home prices plummeting and incomes drying up. So if you want a simple question as a litmus test it should center on what industry is going to compensate for the lost housing industry? I have yet to see a good argument about job growth.
Before I move on to the article investigating an interesting story of three homes on three blocks in Compton, I want to say thank you for helping this site reach the 5,000,000 hit mark. Many of you have been reading this blog for years and I sincerely appreciate the long time loyalty. Many of you may recall when we were a small minority in the middle of California bubble mania. As we go forward, I will do my best to continue giving you an honest take on what is going on. If I have learned anything in these last few years, it would be that you as a smart consumer of information should verify data and arrive at your own conclusion no matter who is saying what or where the large crowd is going. I am appreciative of all the e-mails and from all the other dedicated bloggers who have been working so hard to create an alternative outlet for information. With that said, let us now continue to the article.
Tip #1 – Please Refrain from Using M.S. Paint for Real Estate Ads
We’ve discussed the need for agents to use better photography in advertising real estate. One common theme in Southern California is garbage can photography where agents simply leave the garbage can in the photo of a home that is selling for large amounts of money. Aside from the psychological association between garbage and a home, there are many aesthetic reasons for not doing this. Beside, how much work does it take to get out of the car and move the bin?
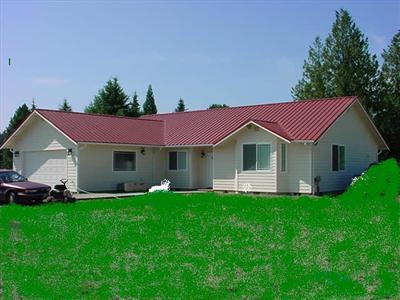
Well this home in Washington State highlights a new kind of real estate ad. It would appear that the grass is edited using Microsoft Paint or a similar photo editing software. Now, I don’t have anything against MS Paint but I’m not sure that I would use it in editing the lawn on a $350,000 home in this current market. This is like you having the ability to own only one family photo and you electing to go to your local strip mall and taking a picture on a bear rug with a waterfall background. Either way, I was surprised to see this. I did a double take but zooming in it becomes rather obvious:
I guess nothing surprises me anymore.
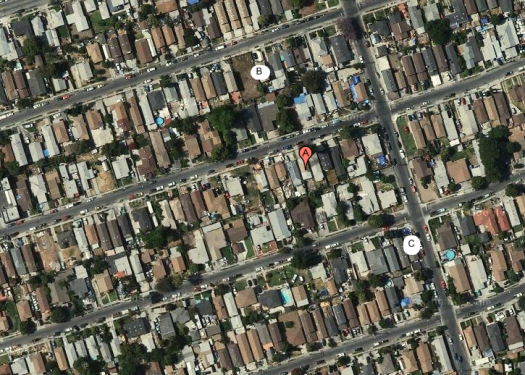
I spent some time looking at a small area in Compton. In this three-block region, I found three homes for sale that all tell the story of the housing bubble but also of easy finance. Before we decide that loan modifications are the way to go, how about we pause and examine what really happened? Here is the map of the area with the three homes:
Today we salute you Compton with our Real Homes of Genius Award.
Compton Home A
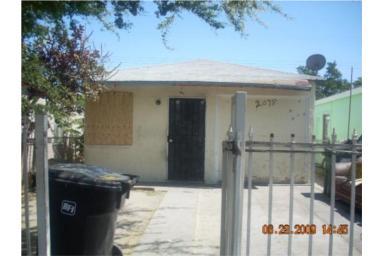
It didn’t take much time to get our first home using garbage can photography. This 711 (not the store) square foot home is selling for $53,000 and isn’t listed as a foreclosure or short-sale. A $50,000 home in Los Angeles County. Now before we get too excited that prices are making sense, let us look at the sales history:
Sales History
02/18/2009: $306,135*
11/01/2007: $357,000
01/24/2003: $112,500*
11/15/2000: $60,000
*Transaction data unclear
Some of the transaction data is unclear resulting from refinancing, transfers, or other recordings but the November 2007 price was a sale. This home sold for $357,000 less than two years ago. Who made this loan? Have you noticed some silence regarding the public-private investment program? It was initially slated to start in July but we have heard very little on this front because the entire program is a sham and would result in many toxic loans jumping into the pool that will be backstopped by the taxpayer. If you didn’t do the math, the price drop on this place amounts to 85 percent in less than two years.
Compton Home B
Another case of garbage can photography. This home is larger at 1,280 square feet and has 3 bedrooms and 2 baths. The home was recently listed at $131,700. This is a bank owned home. Let us look at some sale history to see why the bank now owns this place:
Sale History
01/22/2009: $147,435 *
12/13/2004: $288,000 *
04/25/2001: $131,000 *
11/07/2000: $139,526 *
07/09/1999: $134,000
08/04/1997: $25,000
*Transaction data unclear
We have a tremendous amount of action here. On this place, we are seeing a lost decade in home prices. We are below the 1999 sale price. Who really knows the story on the remaining transactions but these are the kind of homes that are all over Southern California.
Compton Home – C
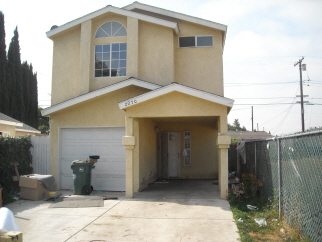
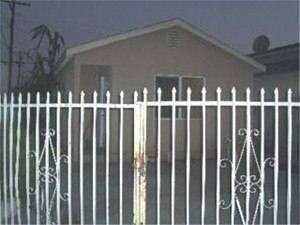
Now here we have fence lens photography. You would think that you would have a better picture for a home selling for $180,000 but this is it. This is a 940 square foot home but once again, we see lots of activity on the home:
Sale History
04/13/2009: $88,000 *
02/17/2009: $115,758 *
06/12/2006: $370,000 *
05/10/2004: $226,000 *
01/30/2003: $44,000 *
*Transaction data unclear
What is fascinating is that from 1990 to 2000 sale and record activity is largely not present or very tiny. Yet all of a sudden in this decade, you have multiple transactions occurring. If we look at this place, the last action was in April for $88,000 yet the asking price is $100,000 above that. This home is only a few blocks away from the slightly smaller 711 square foot home selling for $53,000 and the much larger $131,700 home B.
What should become apparent to you is this; the homes that will move are lower priced. Some times the lower price is much lower than many would have imagined. This data will be factored in future comps thus depressing the area home prices. Many of these areas are dominated by foreclosures (still). Now imagine what a few foreclosures in a mid to upper priced area will do for comps? The Alt-A and option ARM wave will do the same thing as the subprime loans did in the lower priced areas which is push comps much lower. It will lower prices and if agents use garbage can technology here, they are going to be in for a tough market.
Today we salute Compton with our Real Homes of Genius Award.
 Did You Enjoy The Post? Subscribe to Dr. Housing Bubble’s Blog to get updated housing commentary, analysis, and information.


 Subscribe to feed


16 Responses to “Real Homes of Genius All-Star Edition: Today we Salute you Compton. Investigating 3 Blocks of Housing Bubble History and Hundreds of Thousands of Dollars Lost.”
Thank you Dr. HB for all of your informative, insightful and wonderful articles. I have been reading your posts for years….and renting for years, and I can finally have some hope that I will be able to buy a house that is all mine, that I can be proud of and live in for years, without being strapped up to my eyeballs! Cheers to you and cheers to all the savvy future homebuyers out there who smartly decided to wait this crazy housing bubble out!
Case-Schiller is very important index, but in today’s situation is false alarm. During the previous bubble downturn 90-96, in 1993 it showed uptick too after 3 years and 15% down in then smaller bubble and then followed 3 more years and 10% more on the way down for the prices to settle on the bottom. And they stayed there for about 3 more years…
great site for years! your take on the re problem is always months to years ahead. thanks……
We should not get carried away with the little up tick in the Case Shiller chart. Every bubble have and ups and downs on monthly basis and then a correction. The bottom will be flat for years so no need to hurry. The best explanation I can give to the small up tick is due the 90 day of foreclosure delay that artificially reduce inventory thus creating a bidding war from foolish knife catchers. In a year from now this ups tick will look like a little blip on the chart.
If I remember correctly, the “up-tick” in Case-Shiller was merely month-to-month. The year-over-year comparison still showed a 17% decline in prices nationwide.
Did you see the up-tick? It was about the size of a tick on an elephant. In mathematics that move was not even above the noise floor–totally irrelevant; unless you figure that’s the best we can do in summer after tinkling the trillions away we have? Now it’s really scary if you factor in everything! If you only build 2 houses last year and then build 3 this year that’s a 50% spike, but still terrible. The folks I know in building are scared to death. Green shoots? I haven’t seen any. What I have seen is huge commercial properties closing with chains and barricades going up. And this ain’t Vegas, baby…
unless it was sold right after the meth lab blew up the $25K 1997 price on B doesn’t look right.
OK, I’ve been reading the blogs. Convinced there will be correction in the mid to upper tiers. Don’t know when the bottom is, but really is when the issue or the price the issue?
So take the following real example–while I know the prices are sky high, I happened to be looking.
I saw a house that was a nice McMansion in a nice neighborhood listed at 1.55M. I saw a foreclosure come out that was the same model, slightly worse location, but not bad. The foreclosure listed at 1.1 and was gone in a week. I recently saw in zillow the house sold for 1.13. 1.55X70%=1.085M, so this one sold around a 27% discount (sorry too lazy to do the math) from the 1.55M.
In any event, here is the question. Is the 1.13M or say 1.085M home the bottom because its a 30% drop from the 1.55M or is there another 30% drop in the 1.13M. I would assume the answer most folks will say is the 1.55M will probably fall by 40% and the 1.085M is likely due for another 10% or so, but I’d appreciate thoughts on what really is the 30% drop is and how you’ll know it when you get there.
I’ve seen quite a few folks ridicule people who want to jump in now, but if they can find a deal that happens to be 30% off from what the asking prices of homes is today, is that to be ridiculed or just luck. The person who happens to buy at the absolute bottom has nerves of steel and a lot of luck.
I know some readers will say 1.55M is not the fair market value because no one has bought it (which is true, its still listed with a 6 month+ listing). At the same time given that the other house was listed, sold and appeared on zillow in the course of about a month, I’d say the 1.13M house was also not fair market value because it went over listing and closed within a month. More likely you have a value of about 1.175M, and we could fall 30% from that number, but I’ve seen 30-40% discussed so much, its always raised the question in my mind–30%-40% from what?
Congradulations on reaching 5,000,000 hits and thank you for sorting thru the drivel and for being one of the true measures of real estate activity in Southern California.
If that were my house being fenced by a realtor, (painted grass) I’d fire the realtor. Isn’t there something about ethics and misrepresenting a property?
This is about as blatant as it gets!
Ok, so I’ve come to the conclusion that we are crazy. I live in Texas which always seems to be recession resistant, but starting to crack a little. I continue to tell everyone the worst is yet to come. Mort Zuckerman put it best, “The government is addressing a confidence crisis and not the real economy. Which always leads to worse outcomes.” Really Morty….really?????? You’re crazy!!! Oh wait you’re living in reality just like those of us who say this whole deal is false and the worst is yet to come. Here’s to speaking the truth!!! Thank you Dr. HB.
P.S. When you live in excess with a negative savings rate for multiple decades you don’t get out of the crisis in a few months. Just to good to be true. Time to pay the piper.
Congrats DHB. I probably provided you with at lease 300 of those hits. You are a necessity in today’s insane and corrupt world.
“We should not get carried away with the little up tick in the Case Shiller chart. Every bubble have and ups and downs on monthly basis and then a correction. The bottom will be flat for years so no need to hurry. The best explanation I can give to the small up tick is due the 90 day of foreclosure delay that artificially reduce inventory thus creating a bidding war from foolish knife catchers. In a year from now this ups tick will look like a little blip on the chart.”
Actually, no we should be worried, mostly because Case Shiller has no blips! During the run up, we had 55 straight months of improvement – no blips. The first “blip” came in mid 2006 and the bulls all said its just a blip – yeah a blip that carried for 34 months til May 2009!
Its easy to tell yourself this is a blip – and maybe it could be. There has only been one blip in the last 120+ runs in the CS 20, and that was back in 2001, a year after it got started. So yes, maybe this is the second such blip, in 120+ months, and thats what I am hoping for. However, I certainly am sitting up and paying attention now!
I wonder if reporters are in financial/housing pressure in their own live if it effects their opinion about the housing market. A small effort to save their own skin.
The 1990s Los Angeles housing bottom
Wednesday, July 29, 2009 Tim Iacono
http://themessthatgreenspanmade.blogspot.com/2009/07/1990s-los-angeles-housing-bottom.html (Use link to view chart)
…..I’ve pulled this chart out from the previous post for the benefit of those who didn’t make it all the way down to the bottom of what was a lengthy discourse on housing market bottoms.
Clearly, the experience of the Case Shiller data for the Los Angeles area in the 1990s is replete with many false starts, the ultimate bottom coming almost two years after the first positive month-to-month reading in the index with another bottom coming a full year later. ………
FIVE MILLION HITS!??? Wow, I’m breaking open a 15 F. bottle of akkavit tonight. (Well, also because the heat finally broke and I could use a drink after our Death Valley temps this week. 😀 )
~
DHB, it is good to know that your solid thinking and reporting is being read by so many intelligent people. Kudos to you! I can’t believe you haven’t exploded in a volcano of raging schadenfreude by now.
~
On the photo-retouching, I like how the green blob is advancing to cover the shrub on the right side of the house and lapping up over the front walkway. This is almost as funny as the one I saw recently (here in the PNW) where the RealTor pasted in bouquets and bowls of fruit on countertops. They were proportioned all wrong (the apples were 1/4 the size of the microwave) and kinda…floating…and the effect was creepy.
~
Nearly as bad as the time in 2000 the University of Wisconsin-Madison Photoshopped a black man into an all-white crowd scene in a brochure. Enjoy:
http://izismile.com/2009/07/13/ethnic_diversity_i_when_black_people_are_badly_photoshopped_11_pics.html
~
But I digress. Home A looks like it’s being held prisoner with the garbage can as the bouncer. As for Home C, I think they Photoshopped in the house. 😀
~
rose
Leave a Reply to Chipchick