Southern California Housing Report and Bottom Callers out En Masse: 17.4 Percent Jump in S&P 500 in Less Than 2 Weeks. Housing Starts up Because of Rental Units. Sealing the Deal for a Lost Decade.
The market is on a major run. You have to give credit where credit is due. The S&P 500 is up an astonishing 17.4 percent from the low only reached on March 9th which is incredible. Just to give you a perspective on how ferocious this jump is, the median annual return for the S&P 500 since 1988 is 10.88 percent. We’ve nearly doubled that in less than 2 weeks. That is the extent of volatility in our market. Yet make no mistake that this rally has been fueled because of the speed of the fall and a rush by those feeling that this was the bottom. Even after this run up, the S&P 500 is still off by 50 percent from its peak. The U.S. Treasury and Federal Reserve are doing everything they can to siphon off money into the financial sector of this country including a push to redo mark to market accounting by ripping off the U.S. taxpayer. It is now clearer why Bank of America and Citigroup mentioned that they would be turning a profit in the first quarter of 2009.
Some of the most vicious bear market rallies occurred during the Great Depression. When you have fallen so fast even a slight glimmer of light looks like a beaming ray of sunshine. Given how much money has been pumped into the system, it should be no surprise that we will see movements in the markets. Trillions of dollars are floating in the system but where are they landing? That is yet to be determined (aside from bonuses and capital to insolvent banks).
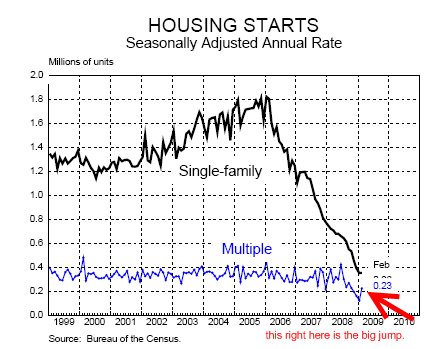
In bear market rallies any news that isn’t bad is seen as warranting a massive rally. Take for example the unexpected jump in housing starts. The media was playing this up like some gigantic move. Keep in mind housing starts have fallen at rates last seen in the Great Depression so a move up is expected. Let us see this massive move on a chart shall we?
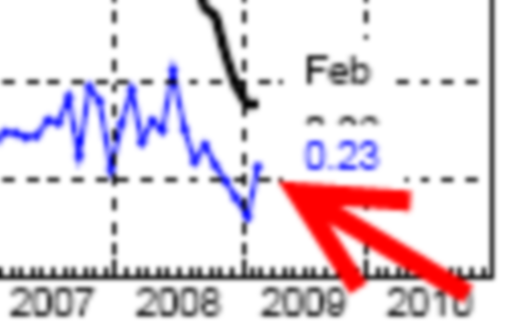
Did you catch that? Let me go ahead and zoom in for you to show you this market moving data:
Some reporters like to spin data. On a percentage basis, it was a nice bump but look at the above charts. The jump was largely anchored in multiple unit housing starts. That is, apartments and places for rent! This is like having a panic attack of happiness because Citigroup moved up 40+ percent in one day even though it translated to a 40-cent move. I wouldn’t read too much into this data. Even if we see mild and sustain growth here, the market has been so viciously pounded that it will take years for it to get out. How much lower can we go any how? It wasn’t like we were expecting it to hit zero. Single-family starts are still off by 80 percent from their peak levels.
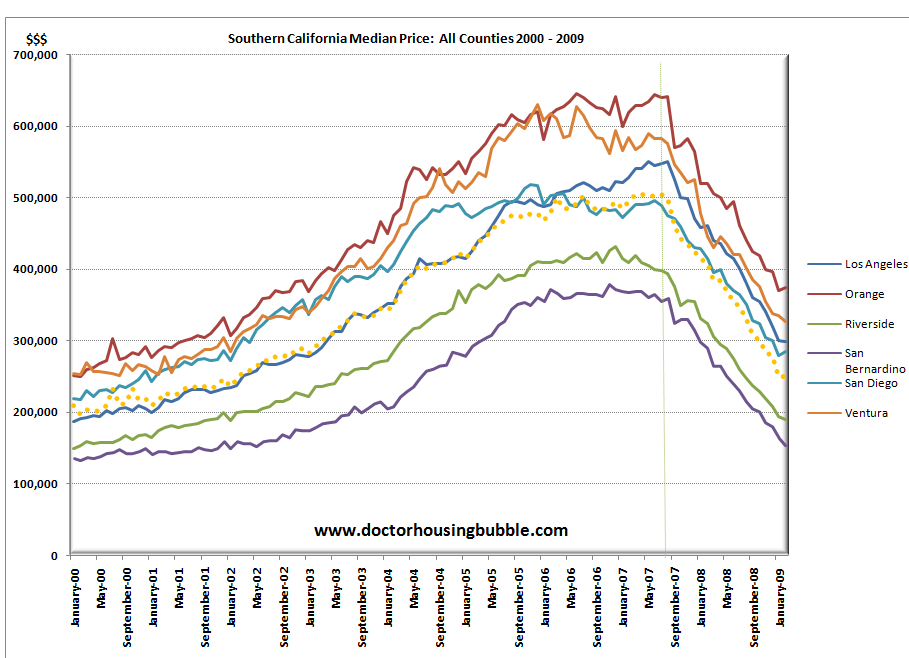
The Southern California numbers were released earlier this week and prices are still moving lower:
The median Southern California home is now at $250,000 and for the first time since the bubble has burst, Los Angeles County has cracked into the $200,000 range coming in at $299,000. This is significant since L.A. County is the most populated county in the region with 10,000,000 people living here. If you look at the chart, you’ll notice that both San Diego and Orange County perked up a tiny bit. I will say this again that there are many bottom callers rushing to buy right now thinking that this is the bottom. It is not. California will bottom out sometime in 2011 given all the regional and market factors affecting our market. But like those rushing back into the stock market for another beating, they will realize within a few months that structural problems are still largely present. Unemployment in the state is at 10.1 percent and rising. Home prices are still out of sync with local family incomes. Yet people still having the taste of those peak bubble prices look at a $400,000 home in a once $700,000 area and think “wow, $300,000 off!” Just because an asset has fallen dramatically in value does not make it worth buying.
As I discussed in detail in a previous post, the state is now back only a few weeks after a major budget passed and is anticipating another $8 billion gap. This is becoming a comedy of errors and is based yet again on Pollyanna projections. Look, there will be a point when it will make sense to buy in California. In fact, there are many states in the country where it does make sense to buy today. So we are not anti-buying homes. Yet as I have been saying for years, prices do not make sense based on the following reasons:
a. Local family incomes
b. Employment projections
c. Neighborhood factors
d. Quality of homes
e. Schools and education
Normally, these are factors that all interplay in creating a price for a home. It is astounding how simplistic the current system is in arriving at a home’s value. In essence, they take 3 similar homes sold in the neighborhood and find an average square foot price and arrive at a price for the home for sale. Normally, they will tweak a bit for additional amenities but that is the extent of the pricing model. Well you can see the flaw with that model especially in a bubble. If homes are selling at bubble prices then you taking 3 bubble priced homes will only give you a 4th bubble priced home. There are more nuanced ways of home valuations and we will eventually get there. Yet we are not there yet. Right now we have a rush to buy from investors and bottom callers because prices have fallen so dramatically. Prices falling by 50 percent will get your attention. Yet they are still over priced based on historical and more conservative pricing assumptions. If you buy right now the only reason to do so is because prices have fallen so quickly. That is it. Don’t try to justify that it is because they are now “cheap” and it is a good deal. Prices will continue to fall.
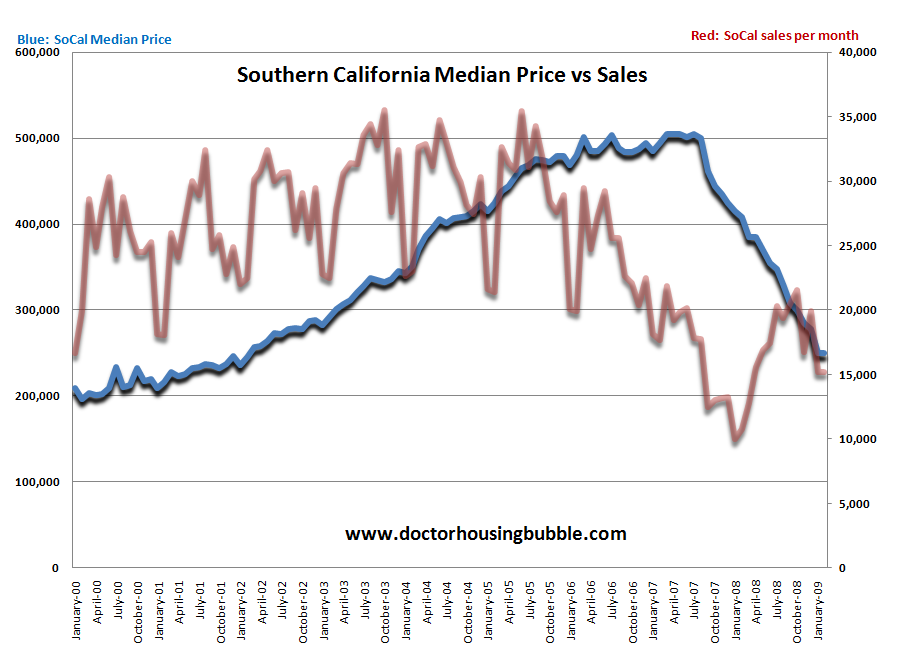
Many are somehow thinking that we are once again in the glory days of the California housing mania. Let us take a look at Southern California home sales and prices:
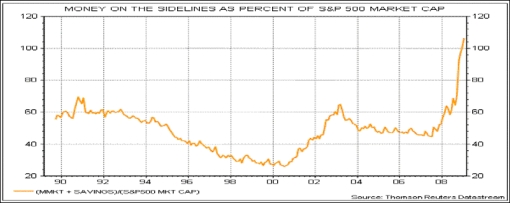
As you can see, we have yet to broach the 25,000 sales per month reached in 2006 when it was the last leg of the Southern California housing bubble. And once again, we are coming off massive lows so any movement up will look gigantic from the lows in 2008. Yet keep in mind for last month, 56 percent of all homes sold were foreclosure resales. So we are still seeing many bargain shoppers and investors picking up homes thinking this is the bottom. Given that you need to come in with 10, 15, and sometimes 20 percent down to buy a home, it is a bad move because without a doubt, home prices will fall by at least another 10 percent in the region. And the next leg down is the collapse of the middle to upper income areas. If we look at San Bernardino and Riverside counties, we can already find homes for $100,000. So those areas are getting close to their bottom. Yet we have prime and semi-prime areas that are still resistant because there is a significant amount of money on the sidelines and many are simply deciding to jump in. How much money is on the sidelines?
We have not seen this much money on the sidelines in a generation. So there is money out there to buy especially since many people are freaked out by the casino nature of our stock markets. In fact, real estate is now looking like a conservative investment compared to some stocks. If you are buying right now in California you should plan on staying in your home for 7 to 10 years because there will be another push to lower prices once the Option ARM and Alt-A loans come to confession en masse. It is nearly impossible for the government to bailout these loans with a straight face but given the suspension of mark to market coming online soon, we can bet that we are going to have our own lost generation just like Japan. Keep in mind one of the large fundamental problems Japan had was that it did not come to terms with bad assets and did not put to rest insolvent institutions. So the new novel approach is to get the bad assets off the books and onto the U.S. taxpayer. How does that solve the problem? The assets are still bad yet now the cost has shifted completely to the taxpayer. With the push to suspend mark to market, we are virtually assuring ourselves a lost decade. Are you going to trust the earnings of Bank of America, Citigroup, Goldman Sachs, and other financial institutions in the first quarter of 2009 now that we know that they can value long-term assets however they please? Wouldn’t we all love that power! Heck, I think all of us would like to think that our 5-year-old cars are worth the amount we paid for them off the dealer lot but if we tried to sell them on the market, good luck getting that price.
All I can offer you is caution in this bear market rally. It would be one thing if we were rallying on awesome and fantastic earnings and the unemployment at 4 percent. That is not the case. Unemployment is rising and earnings for the first quarter will be dismal even with the alchemy of suspending mark to market. It is a sham and I think most Americans have opened their eyes sufficiently to see the massive contradictions embedded in the system. Just take a look at the money pulled out of the markets above. Some are jumping back into the markets but be forewarned, there is much more to go before we hit the true bottom.
 Did You Enjoy The Post? Subscribe to Dr. Housing Bubble’s Blog to get updated housing commentary, analysis, and information.

 Subscribe to feed




17 Responses to “Southern California Housing Report and Bottom Callers out En Masse: 17.4 Percent Jump in S&P 500 in Less Than 2 Weeks. Housing Starts up Because of Rental Units. Sealing the Deal for a Lost Decade.”
Hi Doctor,
good to hear this subprime/SUV/whatever thing is finally over.
Listen it has been nice reading your blog but it is time to move on to something new.
Brings tears to my eyes just like Dubya’s Thumbs Up on the USS Abraham Lincoln.
What does a chart showing money on the sidelines in real dollars look like? Since the S&P 500 is down about 40% in a year, displaying the value as a percentage of market cap makes the dollars out there look like there has been an astounding jump, when much of the increase is really just a rapid decline in the denominator.
Thanks again for setting the record straight. Once again, it is irresponsible headline reporting and Wall Street looking to make a buck. The Fed is still throwing money around like were playing monopoly, SFRs are still in the toilet, and the big incease is in Multifamily Residences starts. That would make any sane person think that builders know people won’t be able to afford SFRs in the future and Inflation is going to bite us in the #%$@!&*. Westside Real Estate is at best crawling along and SOME sellers have begun pricing their homes more aggressively.
Smart money still won’t touch anything right now.
http://www.westsideremeltdown.blogspot.com
http://www.santamonicameltdownthe90402.blogspot.com
Very informative post. You said it best when you mentioned the use of caution. Opportunities are aplenty but buyers and potential investors must be aware of the risks.
Comrade Housing Bubble,
I’d like to add a voice to the chart showing Southern California sales. The news is rather mixed and I think that is what is confusing the market. If you look at sales in the “off-season” (Q4 of each year), sales are significantly higher in 2008 than in 2009 due largely to the drastic drop in price. However, compared to the previous 9 years on your chart, it is still the second lowest. Therefore, the data for this past Q4 is either good news or bad news depending on what you compare it to. Selective comparison is a common marketing technique. It’s like saying car A goes from 0-60 faster than car B. However, when looking at the overall picture, car A might still be a POS with a big engine. It is very likely that sales will continue to rise as we go into “prime season”. As a result, we’ll hear more and more bottom callers.
The point I am making is that the story behind the data is beginning to change and the good Doctor does an excellent job sifting through the hype and getting to the fundamentals. It’s helping to differentiate between a plateau (in this case sales) and a bottom. You would think the MBAs on Wall Street would know the difference too. By the way, does anyone know the difference between Paulson and Geithner? One is bald.
Be brave Comrades!
I gotta agree with the statement you said to be cautious in this bear market rally. I mean just look at the stock market today, it is down again. And I also like your comparison to it being like the Casino 😉
What would anyone consider northridge, granada hills, and porter ranch as; semi-prime or prime. Prices have fallen here probably about 35-45 percent. I know they will fall further, but I just want someones opinion on what they think will happen in these areas and if these areas are considered semi prime or prime.
Yoggi Bear,
I’m interested in that area as well, I would call those areas as semi-prime. The rule of thumb I am using is looking at prices around 98-99 on zillow and using that price. Seems we are still 20-30% away from those prices. I am hoping another year or so and prices will come down to that level, assuming the government doesn’t delay the price drop.
I guess there are still some more suckers out there, but the youngsters only know what they know. Most of the young folks I talked to were not aware of the 1982 recession. Keep in mind, that recession was forced by raising rates until the economy broke, just to kill inflation. This mess happened with the fed dropping to zero. They have experts trying to find a positive number less than zero right now.
Fortunately the powers learned that you don’t have to whip inflation now, just distort the metrics and call it low inflation no matter what. And if it works for inflation and GNP (oops, now it’s GDP) and M3 (oops, M3 isn’t reported any more) we can use it for unemployment figures too (U6, no how about U3?). If we don’t like any of the numbers, we can seasonally adjust them. Remember last spring when the gas prices hit an all-time high and they actually were considered a drop in price when seasonally adjusted?
Thanks Doc, for finding some useful trends rather than headline distortions. If we call ‘Rosie ODonnell’ ‘Jessica Alba’ does that really make a difference?
When only 50% of Americans have only 1 month or less in savings it is not possible for the real estate (or stock) market to recover. Much greater savings is needed, and therefore much less consumption. I couldn’t imagine having less than 1 month of cash available. No wonder credit card companies are slashing credit limits amidst record defaults.
http://www.marketwatch.com/news/story/Fears-grow-more-consumers-just/story.aspx?guid=%7B504D22FD-CC66-4FC1-BF8D-2F199C2AD042%7D
WNBC-TV had a report on what you get for around $3,000 per month by renting last night. A 2bd 1 ba in Hoboken NJ or a 2 bd 1.5 ba in an converted SFR in Yonkers NY. They also said how renters now are having an upper hand in how much landlords will be able to charge.
Oh, by the way the Yonkers property is in an area that isn’t bad but not the greatest. You will end up putting your kids in private school.
I love your examples! “any glimmer of light” I believe we aren’t at the bottom… how can we even be close when banks are suspending foreclosure and we are propping up businesses left and right. Unfortunely, things HAVE to shake out before we can start back up.
KOKO
Thanks. Ya I was looking at those prices as well cause I am sure alot of people got ARM loans during the bubble and they are soon going to be screwed. I was thinking it will take 2 years cause the govt is trying there best to gradually cause prices to go down so they can get as many people as they can to buy now. But if prices drop to 98-99 levels a nice 5 bedroom home and 4 baths was around a million and if prices drop would be around 400,000 to 350000 which is crazy. What do you think KOKO
Great insight.. I really appreciate the realistic perspective. I think we are in for a ride. However, I do think a break or maybe even a false break might let a few people breathe. This I think can be a good thing. Do I think we are heading back up? No way, there are a lot of indication that point to the opposite. I think the key is the median home price. At some point when properties are at a whole affordable compared to the average salary of the area perhaps we will see a true uptick?
http://utahcribs.wordpress.com/
As investors we are much like Charlie Brown. Lucy tells us every fall she will hold the ball for us to kick it, but every time pulls it away once we have committed…Everyman never learns, does he?
Trust Cramer and his Kudlow Krownies to extract any bit of value we have accumulated from hard work and savings.
Doctor, you think we only have a 10% drop to go? I have to disagree with you on that statement, most areas, including Riverside and San Bernandino have much more to go. I seen new vacant homes in Riverside for $400,000, no one in their right mind should pay more than $150,000 for those homes. Riverside has one of the worst school systems in the world, and supposibly this $400,000 homes are for young families, if these families can afford $400,000 for a home, why would they buy in such a bad location?
Yoggi
I do believe a 5 bed house will go for 350-400 think about it, 400k that means @ 10-20% down 40-80K with full documentation you would need to be making >130k a year, most people in the valley do not make that let alone all the debt I see with their brand new cars…. Hey the stock market is at 97′ levels why would it be crazy to believe the houses can’t reach those levels???
Leave a Reply to Koko