
Predicting the Housing Future: Los Angeles and Orange Counties. Using the Case-Shiller Index to Find a Bottom.
Predicting future prices is a dangerous game. Trying to predict peak prices during a mania is like predicting the future behavior of an insane person. By definition their nature is not predictable and thus trying to determine what they’ll do tomorrow may be a fruitless exercise. Yet now that we are slowly moving to historical rubrics to give credit out, we are quickly realizing how insane this bubble got. The straitjacket has been put back on the market and it turns out that someone left the door open on the credit asylum for too long. Time to gather the lunatics back in.
This week the weather has been perfect in Southern California. Across many areas we are in the 90s and all the beautiful people are out on the streets. Many are out walking simply because they cannot afford to fill up their gas tank but hey, that is the silver lining. In the end, many folks need to get out there and walk so they can lose some weight. And if you notice that people are not looking as beautiful as they once did in Southern California you can blame it on the credit crunch. Elective cosmetic surgery is down so expect to see more natural looking folks running around minus the fixed nose and other synthetic implants. In a way, we are metaphorically returning to a natural state of things. The time for artificial products will need to be put on the shelf for sometime.
California was the epitome of this housing bubble. We had the largest excess and now we are seeing the biggest bust. I would call it spending like a drunken sailor but I really haven’t met too many drunken sailors in my lifetime. How about we try coining a new term with a California twist. Whenever you see someone spending like a maniac blowing cash beyond their means, we can label it “Spending like Laura Richardson” or SLLR. So if you have a friend with a leased Lexus and Hummer and a mortgage that will make Ed McMahon look frugal, you can tell them, “hey Bob. You are spending too much. Why don’t you stop spending like Laura Richardson?” This of course would be a massive insult with a California twist that only a foreclosure specialist can produce. You can watch as they begin to cry with your below the belt insult. After all, if people are willing to elect such a financially irresponsible person, we might as well get something for our tax dollars. A phrase is all we can afford at the moment.
Before you feel bad for six-figure politicians, this article is going to attempt to look at the future of Southern California housing. The reason that we can start making educated guesses now is that the party has come to a screeching halt. We now have a static peak that we can work off from and apply some financial logic to what will happen over the next few years. I wrote an article aptly titled Nostradamus in the House. Looking at 4 Potential Scenarios for Southern California Housing on August 4th, 2007. Of course this was a few days before the massive credit crisis that was supposedly over many months ago. In the article I also have a swipe at WaMu which at the time was trading at $37 a share (today it closed at $6.38). Essentially, we are now at the worst case scenario from that chart. So we will now revise it for the next year.
1 – Looking at the Case-Shiller Index Past Los Angeles Bubble
The Case-Shiller Index uses the MSA (metropolitan statistical area) to track housing prices. The Los Angeles component of the index combines Los Angeles and Orange County. Given that these two counties have more than 13 million people, it is a good representation of the housing insanity that is going on in Southern California.
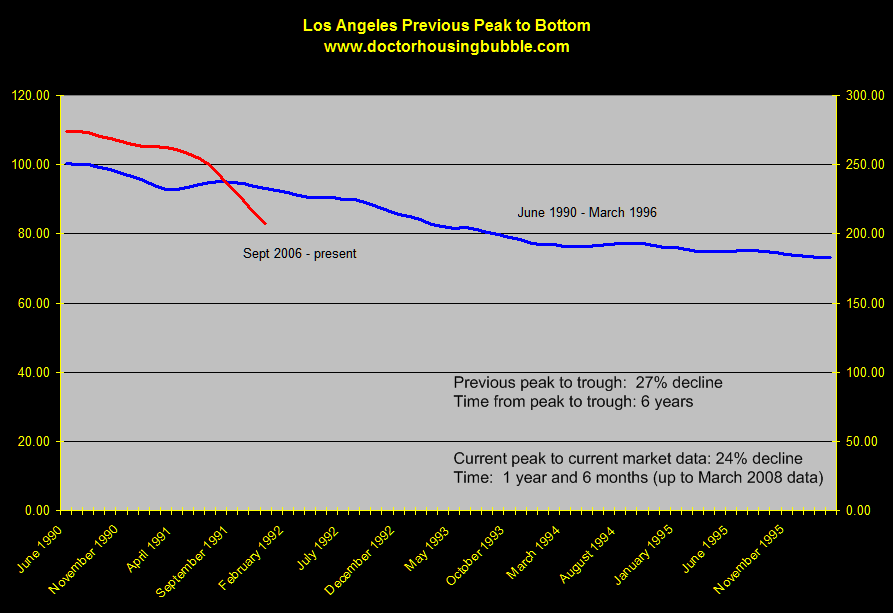
Some people may not know that Southern California had a previous bubble in the late 80s to early 90s. At this time our national economy was in a recession and the economy was once again a main focus for politicians. On this constructed chart, I used the previous peak (June 1990) and bottom (March 1996) and superimposed the new peak (September 2006) to give a better idea of how much more further we have to go to reach a bottom:
*Click to enlarge for a clearer image
The data in the most recent iteration of the Case-Shiller index goes until March of 2008. The startling thing you will notice is it took over 6 years from peak to trough in the last downturn with an overall decline of 27 percent. Now, we are only 1 year and 6 months from our peak and the market is already down 24 percent! And we have yet to see $500 billion in pay option ARMs to recast with 60 percent here in the state. California it would appear was Spending Like Laura Richardson (SLLR).
As the market is being slapped around like a mortgage piñata, people are scrambling to gather the little bit of real money that was locked inside. The reality has become that people equate credit with money. To a certain extent it is. But now many that have had their credit lines shut down and lost all their equity are realizing that credit is not as good as cold hard cash. There is a reason people say cash is king.
Now back to the chart it would be hard to conjure up any reason why we are nearing a bottom. The California economy is in such shambles, that we are getting cockamamie ideas that only serve as a good laugh. For example, some proposals include letting out inmates early onto the streets where there is very little employment. Guess what will ensue if that happens? Also, the Governor is throwing around a lottery idea which is the absolute stupidest thing one can propose. Yes, we are broke therefore let us exploit the most primal part of our humanity and take money away from those that do not understand basic statistics. Good job amigo! The fiscal year starts in July and it looks like we are going to have a bunch of arse grapping and posturing before we get any budget through. Ironically the budget is following the trajectory of our old governor Gray Davis.
Can prices go down for 6 years like the previous burst? Absolutely. The economy is in much worse shape and the types of mortgages floating out there would make Enron seem like a walk in the park.
2 – Income is Stagnant and Credit is Closing Shop
I can tell you as someone who has gotten mortgages at the peak, things are radically different now. All my investment properties are financed the old school way with 30-year fixed mortgage even though many brokers and lenders tried to convince me otherwise. Many of those folks are no longer working. Trying to get a loan in 2008 is a world away from a getting a loan in 2003, 2004, or even 2005. The market has dried up. Getting a loan in today’s market requires good credit, solid DTI ratios, and basically if you want a good rate it will have to be a primary residence. So now, income apparently matters. And as it turns out, we have a crew of people that were living in an economy were income didn’t matter. Welcome to a quick reality check.
Here are some basic statistics for the Los Angeles and Orange County markets:
Los Angeles County:
Median Household income (2004 census): $43,518
Orange County:
Median Household income (2004 census): $58,605
Now I know many of you are going to cherry pick tiny enclaves in Newport Beach and Beverly Hills but you need to remember that the Case-Shiller data looks at the entire metro area. As much as you would like to siphon off 80 percent of the population and only examine 20 percent of the prime areas, this is not how the data is compiled. The above figures show us how out of whack prices have gotten here in Southern California. Let us look at the current median price in both areas:
May 2008 Data
Los Angeles County Median Home Price: $422,000
Orange County Median Home Price: $485,000
Compare that to the previous peaks of $550,000 for Los Angeles and $645,000 for Orange County. Given the current income we have the following ratios:
Home to Yearly Income ratio
Los Angeles: 9.69
Orange: 8.27
Let us compare this to data from 2000 to highlight how much of a correction we will need to come back in line with historical ratios:
Los Angeles County Household income 1999: $46,452
Orange County Household income 1999: $57,706
June 2000
Los Angeles County Median Price: $203,000
Orange County Median Price: $273,000
Home to Yearly Income ratio:
Los Angeles: 4.3
Orange: 4.7
So given the ratios starting in 2000, we would need a few things to happen. Either incomes double in the next few years or prices go down by half. Given the state of our economy and stagnant wages, you can rest assured that we are going to reach more reasonable rates by prices continuing to fall.
3 – Inventory on the Market
Given the vast amount of inventory floating out in the market, we can say with authority that simply looking at demand and supply prices will continue to fall. Let us look at inventory:
Current Data June 2008:
Los Angeles County: 52,956
Orange County: 16,250
Sales for May 2008:
Los Angeles County: 5,445
Orange County: 2,266
Months of inventory:
Los Angeles County: 9.7 months
Orange County: 7.1 months
Now you also have to remember this is based on MLS inventory. We all know that lenders are being owned by REO inventory and with record amounts of NODs, this number is artificially low. So we can add 2 or 3 months of inventory for each county. Bottom line is until we get closer to 5 or 6 months of inventory you can rule out any stabilization talk. My estimate is we are going to see shadow inventory “surprise” people in the next few months.
So when will things bottom? To be blunt, not in a very long time. Just look at the above data. Do you really see prices jumping up anytime soon? I will safely say that when all this is said and done, Los Angeles and Orange counties will be off by 40 to 50 percent from their peak. And this is being conservative knowing what we know now. If someone has some reasonable argument to the contrary I’m completely open to hearing it but all I’ve heard is a bunch of hot air and fluff that sidesteps the hard facts.
Enjoy the great California weather and if your significant other is pressuring you to buy a home tell her you are not going to be Spending Like Laura Richardson. They’ll understand.
 Did You Enjoy The Post? Subscribe to Dr. Housing Bubble’s Blog to get updated housing commentary, analysis, and information
Did You Enjoy The Post? Subscribe to Dr. Housing Bubble’s Blog to get updated housing commentary, analysis, and information
 Subscribe to feed


15 Responses to “Predicting the Housing Future: Los Angeles and Orange Counties. Using the Case-Shiller Index to Find a Bottom.”
I think the key factor is the price-income ratio. Why? Not because it’s sexy or fun or easy to use. But because it makes complete and utter logical sense. Well, perhaps not complete sense because it doesn’t factor in interest rates or changes in taxes. But, assuming that exogenous factors remain relatively constant (e.g., taxes down but interest rates up) then the amount of house a buyer can afford is intimately linked to how much money he can spend.
This bubble went beyond affordability, way beyond it. In fact, un-affordability was practically touted as a good thing, because it implied that people could sell out their house and buy another they could afford with the profits from the first. Obviously this is ridiculous unless everyone down-sizes!
If the bubble were built entirely on a psychological foundation, I would expect it to revert to somewhere above the long-term price-income ratio. I don’t have any economic or mathematical reasons, just intuition. But since the collapse is now linked to a recession, massive inventory, reduced credit, and higher interest rates, my intuition tells me we need to revert to far below the long-term mean to abosorb the inventory and restore balance to the equation. (The long-term price-income ratio of about 3.2 is either restored by having prices drop below the ratio or the ratio itself moves up. Since calculations of this ratio extend far back, I see no reason why it would move up. In fact, there are compelling reasons why it should move down over the medium term).
If the median income in LA county is $46k, then I fully expect the median house price to drop to something like $140k. For those of you who scoff at this and dismiss it as the ravings of a real estate bear, think back on what you were saying four years ago, two years ago, and even six months ago. Basically, all the real estate permabulls were idiots. Those who saw the bubble for what it was and profited from it were shrewd, perhaps evil. The rest of you are banned from prognosticating as you should be banned from buying homes or handling any sum larger than $100.
Burn, baby, burn.
I for one agree 100% with this article and everything else that you write for that matter. It’s what made me a regular reader to this great blog in the first place. The housing re-adjustment back to “normality” is going to be one of the biggest stories of American history. We are fighting 2 wars that are dragging the economy down, wages and employment are flat. People spend out with their means. Living costs are ever increasing. Corporate greed is rampant. The housing market was a false reality always was. It does amaze me, like the housing bubble, the bubble many live in today, this is only the beginning folks. Thanks Dr HB.
Where is the bottom to the California Housing bubble? Probably when the avg monthly mortage payment gets near the average monthly rent. I don’t think we are anywhere near that yet and I’m too lazy to figure it out. Both of those factors will head lower if the economy worsens.
like I was trying to say, when prices are such that the average monthly mortgage payment is near that of the average monthly rent payment, California housing will have found a bottom. Of course, if the economy worsens, both of these factors drop further.
Dr. –
Once again, great article!
One item that I would add, and I believe is a major piece of why this will be worse than the early 90s……Exotic mortgages.
All of these ARMS, Option ARMS, etc. DID NOT EXIST in the previous real estate market run-up and down-turn. Think of this as throwing gasoline on an already burning fire, as these creative products were a smash hit while the RE market was on fire (bubble), but all were never tested in a down market.
I have many friends that thought I should buy a house. A common conversation went as follows:
“How did you do with your stocks and investments?”
“I earned 15% last year”
“Is that all? You should buy a house. Our home went up 20%. We pulled out $50k to buy a new BMW (4th car for a 2 driver household) and new furnature for the house.”
“So you borrowed $50k from the bank? Don’t you have to pay it back? It’s not free money.”
“You don’t understand. We’ll just refinance again. At this rate, our home in rural NorthEast San Diego county will be worth $1.5 million by 2011. Everyone wants to live here. You should buy a house.”
As you mention, this recession will be far worse than in the 1990s, and will have the “X-Factor” in addition to the slow economy, unemployment, etc. That “X-Factor” is the creation and use of the exotic ARMs.
Just wait until this “dead cat bounce” never materializes. Imagine the increases in inventory when the banks finally get around to listing their REOs, as well as more and more walk away from their sinking ships. This fall will be a huge downer, which will lead to more layoffs, leading to more foreclosures. Wash, rinse, repeat.
As my father has said many times, “You can never have too much cash.” Once again, he is right.
Don’t forget the fact that millions will have their credit in shambles and will not be able to buy a doghouse on credit much less another house. Look out below.
It is hot as heck this weekend in Southern California. It depends on where you are of course as the more expensive coastal areas are a lot more temperate than a bit further inland (even downtown is further inland), but it is really really hot this weekend.
I do have a point of relevance here, the weather in Southern CA is getting warmer (due to climate change and urban heat effects likely), but regardless it is definitely getting warmer, and if this continues how ridiculous will paying 550k for a house in Phoenix, I mean Los Angeles which will be the NEW Phonix have really been? If the strongest point in CA’s favor is the weather and the weather becomes unbearably hot, then what exactly does Southern CA have to offer? A broke state with an incredibly high cost of living? Well gee ….
I’m theorizing way out there I know, but it’s also personal, I’m not seeing a lot of charms to make me want to own here recently with ever more unbearable weather and oh yes a high cost of living and housing prices still being completely ridiculous!
Oh and as Dr HB points out, the median income seems to be flat in L.A. in the last few years (although more recent numbers would have been nice) and I didn’t read anything about those being inflation adjusted figures. Adjust for inflation and there’s a serious decrease in the median income. Another good reason to buy a house here! Not.
js – Here is the most recent income data. You have to understand that the data released in one year was usually gathered in the prior year. The data gathered in 2007 is not out yet.
LA County – median household income 2006 = $51,315
Orange County – median household income = $70,232
Not sure what source the 2004 data cited is coming from as the US Census has the data reported 2000 and 2006. It shows median household income in 1999 for LA County as $42,189 and for Orange County as $58,820.
$42,189 in 1999 is the equivalent of $51,999 in 2006; and $58,820 in 1999 is the equivalent of $72,498 in 2006.
As you can see, LA County had a very slight drop in income after the 2006 numbers are adjusted for inflation (all of $684.) Orange County had a substantial drop of $2266.)
Don’t forget already appalling and increasing taxes on those few of us who actually pay them here to cover all the social services js! After all, we’re a “sanctuary city.”
It seems to me that L.A. gets worse every year – I have a hard time imagining wanting to stay here long term, though I may have become biased by living in the hellhole they call downtown.
Just one quibble with you, doc – I’m in San Diego and this weather is FAR from perfect! It’s so hot that everyone is miserable. “Perfect” would be 80 degrees…but it has been up to 100 in the past few days! It feels like the Midwest!!
Other than that, you are spot on, as usual. Anyone who thinks we have reached a bottom is practicing wishful thinking.
Are the median income figures accurate?!
LA
2004: $43,518
1999: $46,452
OC
2004: $58,605
1999: $57,706
What the hell happened in LA? Median income FELL by 7% in five years??? If these numbers are accurate, it makes the bubble even crazier.
Ive lived in California my entire life,
High temperatures during the summer are not uncommon here. And even the most aggressive global warming show small temperature changes over short periods of time.
The Washington Post reports housing prices in the inner ring around DC have crept up reflecting the rise in commuting costs both in time and dollars while the outer suburbs are collapsing. Thus, as always, location, is the key to value in real estate. Given this and understanding that Southern California is not a typical
eastern city with well defined downtown, it would be interesting to see just where home sales are actually occuring in the SoCal real estate market. What it may suggest is that the median price recorded in home sales is reflecting a premium for better location despite a slump in prices. That is, the real picture maybe much
worse because homes in poor locations aren’t selling at all and thus are not being tallied in median price statistics. As California counties are very large geographically themselves saying that the median price declined 27% in Orange
County might mean it only declined 10% for homes near jobs and shopping but declined much more for homes not so well located or the sales of such homes are so few and far between as to give no indication of their present value.
Good article but to suggest at the end of the article that the free spender of a couple would be a “her” is a bit sexist. Also, considering that gay man can get married in California, who exactly would be the “her” in that coupling? 🙂
Just thought I’d speak up on that point. Thanks for the excellent blog.
Jeff
I think that the Cal. housing market will overshoot the 40-50% down from the peak prediction. I think the market will be down at least 55% based on the option ARM resets and the economy. I have been seeing more people laid off than ever before in my 50+ years. This down turn will be more like Japan from 1990 to today. We will be suffering for over 10 years with “boat anchor” for houses. Don’t catch a falling knife untio it’s stopped!
Leave a Reply