10 important real estate charts showing no housing recovery in 2010. Collapsing housing starts, Texas Ratio problems, construction spending at trough, and real estate equity evaporated.
The housing market has been turned upside down with unprecedented amounts of government intervention that even the seasonal pattern has changed. Keep in mind that spring and summer are usually the most optimistic selling times in any given year but this year with the tax credit ending and the Federal Reserve done buying up mortgage backed securities, the housing market will face weaker conditions in summer. The amount of noise floating out in the current market is deafening. How is it possible to have a market that is getting better when unemployment in many top housing bubble states remains at peak levels? In California unemployment remains at 12.6 percent (a modern record high) and we have over 100,000 unemployed Californians that have now exhausted a stunning 99 weeks of unemployment benefits.
This is happening all over the country. There was a recent article showing that 40 percent of those employed nationwide are currently working at low paying service sector jobs. Will these people bring on housing boom 2.0 with Wal-Mart wages? Today we’ll be looking at 10 charts that show us a very clear picture of the nationwide housing market. What we find is the housing market is anything but steady. From Alt-A and option ARMs to strategic defaults we are dealing with trends we have never seen before.
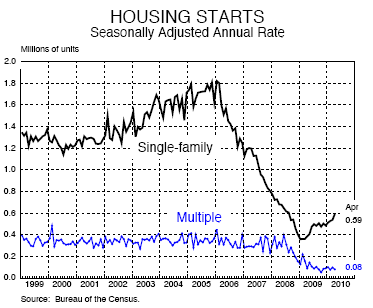
Chart #1 – Housing Starts
At one point housing starts were operating at a 1.8+ million SAAR. Even today after all the trillions of dollars pumped into the housing market we are operating at 66% below the peak of 2006. Just imagine the number of construction, finance, and real estate related jobs that are now gone because of this contraction. This crash level has only appeared one other time in history and we would have to go back to the Great Depression for that.
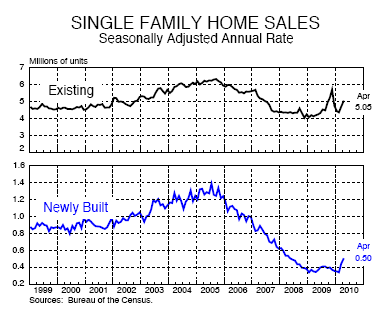
Chart #2 – Single Family Home Sales
The recent jump in home sales, both newly built and existing is as artificial as the fruit flavor in your soda. And this is saying a lot given that we already subsidize the housing market like it was going out of fashion. We subsidize housing through interest deductions, artificially low interest rates, and basically using the government seal of approval for the entire mortgage market. Even with all of this, we had to sweeten the pot further with another front-end tax credit to get sales to move up. That is now over and right when the credit ended, preliminary data shows that home sales and applications are starting to trend lower. So what can we derive from this? That housing without complete and ultimate government subsidies doesn’t have a leg to stand on. Yet this puts a mask on the more perverse problems of underemployment and weak wage growth. The big mistake made here is that we put housing ahead of employment growth when focusing on dealing with this crisis. But then again, the people had no say here. This was guided all by the crony banking system policy and for them, real estate was the focus from the beginning.
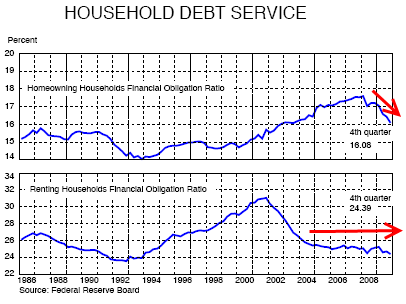
Chart #3 – Household Debt Service
I love this chart because it clearly shows the housing bubble in full context. Starting in 2000, households took on much larger debt simply to buy homes. It wasn’t a rise in income but a desire to play into the mania. At the same time, those that remained as renters saw their overall debt load go lower. It is the case that many prudent households refrained from buying at inflated prices and stayed renting. Because let us be honest, anyone that wanted to buy a home in the bubble decade was able to get a loan as long as they were able to fog a mirror. So the amount of those who bought homes shot up and debt service is still relatively high compared to the early 1990s level of 14 percent (we still need a drop of 2 percent to get back to that level). Expect this trend to continue.
Chart #4 – Texas Ratio at Big Banks
Source:Â BankRegdata
The Texas Ratio shows us that the too big to fail banks still have a large amount of toxic waste on their balance sheets. How is this calculated?
(non performing loans + real estate owned) / (tangible common equity capital and loan loss reserves)
And as you can see from the above charts, many of the biggest banks have large amounts of bank owned property and non performing loans. This ratio shows us that banks are going to be facing years of toxic loans until they can adequately gut their balance sheet. Since banks wouldn’t be standing if it weren’t for taxpayer dollars, that means we are all on the hook for these massive losses. These ratios tell us that real estate is not even close to recovering.
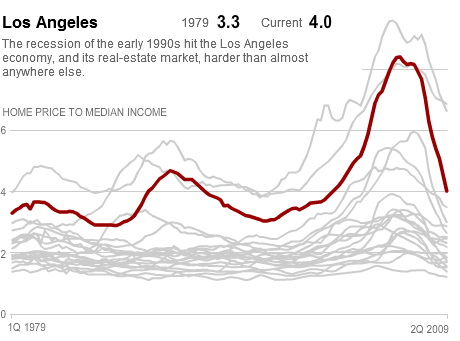
Chart #5 – Home Price to Median Income
As things stand home values in many areas are still overpriced. I’ve seen the above charts used over and over but when you look at the data they are using for income, they are pulling data from 2008! Since that time, our economy has flown off the cliff so the ratio is still high and only appears to be going lower because of income data used from the latest Census survey. Once we get data nationwide in September when the 2009 Census numbers come out, we will see that the ratio remains high in many areas. Home prices can only support what local incomes can shoulder.  This has been the case for a century and we are now going back to tried and tested metrics.
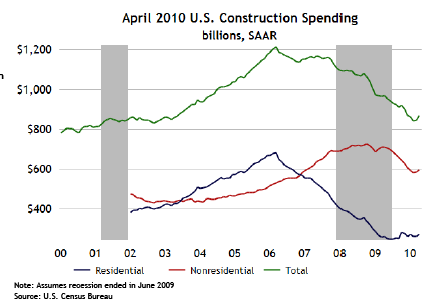
Chart #6 – Construction Spending
You would think that those in construction spending would know something about home demand. If we look at the above chart, construction spending is still near the trough. This applies to both residential and nonresidential building. The market is full of toxic mortgages and vacant properties that there is little need for any home building for a few years. When we look at shadow inventory data we realize that we built for a decade. Some areas are now talking about bulldozing places! This is what constitutes a solution like destroying food in the Great Depression while people starved. The above chart shows where people are putting their money and it isn’t into real estate construction.
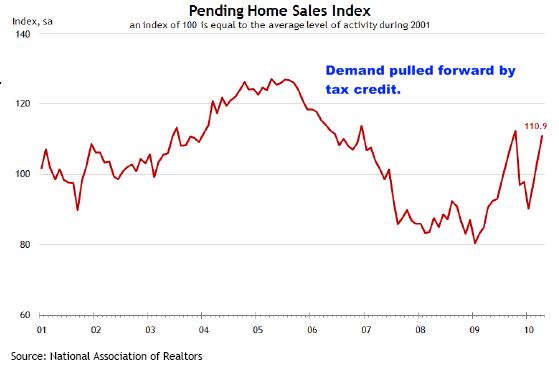
Chart #7 – Pending Home Sales
I’ve seen the above chart used many times as well to show how the housing market is recovering. Only looking at this chart, you might be able to spin it that way. But putting all the other data into context, you realize this chart is an anomaly. In fact, this recent jump in home sales is all thanks to the tax credit. That is gone and leads us into the next chart which shows the next trend.
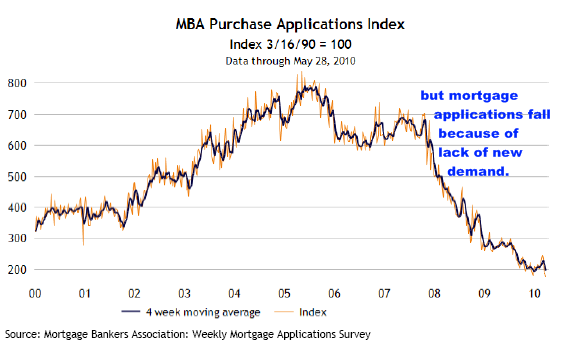
Chart #8 – Mortgage Applications
Mortgage applications have collapsed. It should come as no surprise given the pull forward. In fact, activity is so low because we have to remove all of the refinancing activity that we had during the housing bubble days. So now, mortgage applications are for home sales typically. Many times, these are one and done deals. That is, someone buys a foreclosed home and that is it. In the bubble days, you had someone selling a home and then buying one at the same time (two mortgages compared to one). There is little reason to believe this will be booming anytime soon.
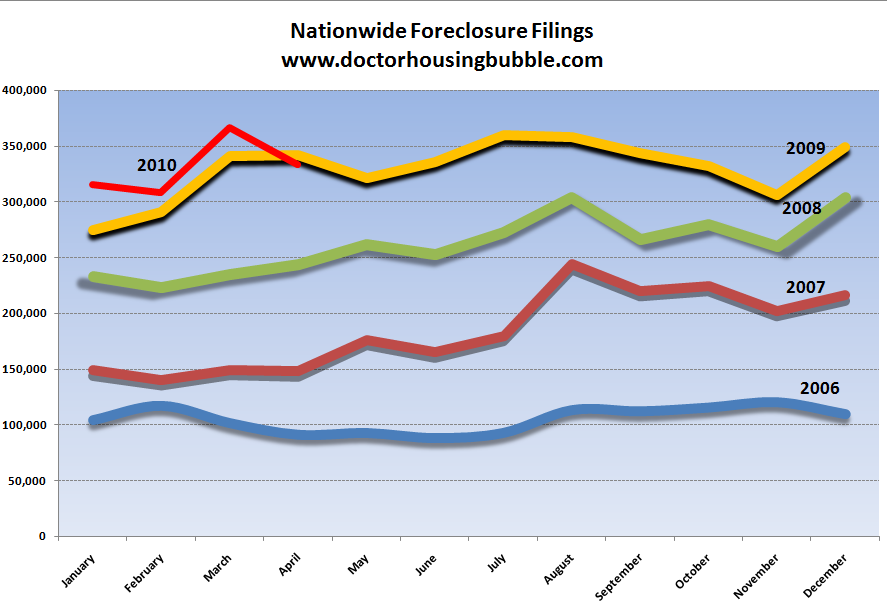
Chart #9 – Nationwide Foreclosures
Contrary to what we hear, foreclosures are still at record levels. We are on pace to seeing 3.5 to 4 million foreclosure filings in 2010. And this is good news how? Now we are seeing foreclosures dominate prime markets just like we saw in toxic mortgage markets a few years ago. FHA insured loan defaults are at record highs and Fannie Mae and Freddie Mac have quarterly billion dollar losses as if this were a common theme. Until we see foreclosure filings dip to the 100,000 to 150,000 range per month, any housing recovery talk is nonsense.
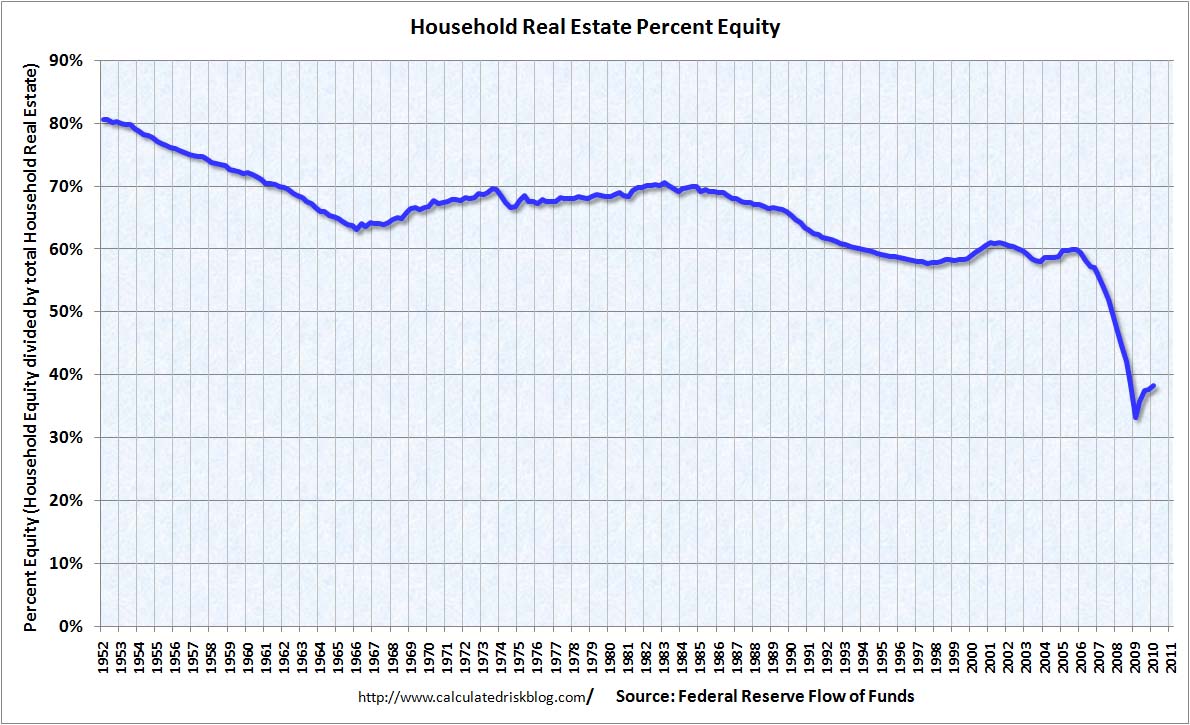
Chart #10 – Homeowner Equity
Source: Calculated Risk
This chart tells it all. Homeowners are tapped out. Keep in mind the above chart also includes the one-third of homeowners that actually own their homes free and clear. So the reality is, those that own a home with a mortgage have much lower equity than the current headline. With one third of mortgage holders underwater, there is little HELOC and home equity loans to be tapped out which supported our economy for the entire bubble decade.
The above charts don’t show any signs of a housing recovery. The only sugar high jump came from the tax credit but even with that, you can see how little it did to impact the overall mega-trend. Focus on the facts and don’t get caught up by the gimmicks. We are a long way from any recovery.
Did You Enjoy The Post? Subscribe to Dr. Housing Bubble’s Blog to get updated housing commentary, analysis, and information


 Did You Enjoy The Post? Subscribe to Dr. Housing Bubble’s Blog to get updated housing commentary, analysis, and information.
 Subscribe to feed


25 Responses to “10 important real estate charts showing no housing recovery in 2010. Collapsing housing starts, Texas Ratio problems, construction spending at trough, and real estate equity evaporated.”
I’ve heard that lumber futures are starting to tank as well. Not much housing gets built without the stuff.
Your Home Price to Median Income (chart #5) underestimates the true home price to income levels because of the massive amount of distressed homes selling skewing the median lower by $150K or so. The median home price/income ratio in L.A., San Fran and San Diego remain around 6 to 1 if using real incomes (majority of the homes are being bought by households earning $50K a year instead of the median $75K income {rough average in major cities}). This factor has caused affordability to come down to a false ratio in this chart and charts like them.
@CAE
I actually work for a timber/forest products company in the NorCal (the real northern California)….most tree species don’t have a high enough price at the mill to pay for their way out of the woods i.e. logging and trucking prices aren’t covered. Redwood and Incense Cedar are the only profitable species….and those are remodel species for new decks/porches/fencing. Doug-fir and the Pine species will cost you money cut and get to the mill.
.
C’mon carbon!
Another fantastic, damning piece my good Doctor. Stunning charts, particularly the home construction starts, loan origination, and $ spent on home construction.
Simply ridiculous that Fannie Mae and Freddie Mac will combine for $15-20 BILLION dollar losses PER QUARTER for the foreseeable future…right up there with the $20 BILLION PLUS deficits California will be running annually for the foreseeable future.
And your evidence is all based on cold hard facts and the reality of the data – no crystal ball projections including the obvious – that rates have no where to go but up and we are facing either (more) HUGE tax (or fees/tarriffs/whatever they want to call them) increases and/or HUGE spending cuts.
I happens in most bubbles. The “fake out” bounce where most think the worst is over only to see it fall further still. We are already somewhere in the early stages of the fear/capitulation stage and the ride is just beginning. These are patterns that recur time and time again. Only fools think their own era is special and immune to such trends and as we well know the political class consists mostly of fools. It’s unfortunate that there will be more trying times ahead. Maybe one day humanity will learn to sidestep the BS and face life as it is rather than play silly ‘let’s pretend ‘ games. Or not.
We know what SHOULD happen based on intelligence, logic, and coming to conclusions based on the information at hand. However, people that are rationale and use logic are often wrong, because most people are uninformed, irrational, and don’t think for themselves. In order to get elected, you need to appease the dummies.
My question is – can we expect this fall to happen in the way we expect it, or will some other outside intervention come into play yet again? I remember reading articles about a housing bubble back in 2002, and we know it continued to get much worse after that. The stock market should have never rallied 85% last year, but it did. I guess I’m just trying to figure out what will actually happen. Too often we can’t make sense of this stuff until after the fact. I hope housing continues to fall so it actually IS affordable (not just affordable via massive debt). It makes sense that it should come down. With most states being broke, I don’t see how the gov’t can intervene to keep it propped up anymore. Does anyone else see a way that some stupid policy or stimulus can drag this out longer than it needs to go? Could there be anymore hidden bailouts on the way?
One idea that is bouncing around is raising state income taxes in CA yet again. State income tax rates are already near the highest in the nation (it’s hard to make comparisons due to brackets, but as we all know CA taxes are quite high). I’d be more accepting of the state thinking about raising this renter’s taxes if the state wasn’t also handing out 10 thousand dollars right and left for home buying credits.
Has anyone here heard any hard facts about a new sales tax on home sellers included in the Health Care Bill?
“Does anyone else see a way that some stupid policy or stimulus can drag this out longer than it needs to go? Could there be anymore hidden bailouts on the way?”
As far as dragging this out longer than it needs to go, that’s what the powers that be have been doing for the past couple of years via the various bogus stimulus (theft of the public/taxpayer coffers and shifting/THEFT of wealth to the TBTF banks and ultra wealthy), tax credits, purchases of mortgage backed securities, derivatives and MBS/CDS shennanegans etc. And no doubt it will continue and drag this out for years if not decades thanks to the nonstop printing press monetary policies we are employing to avoid the dreaded deflation…ultimately this will result in runaway inflation.
We should have bit the bullet and let the excess credit be destroyed and suffer the harsh reality of deflation…this meltdown would have been extremely painful however no doubt we would have gotten through most of it much faster instead of spreading the pain to (almost) everyone and over decades.
Anecdotal story: In 1993 I looked at a condo right on the beach, newly constructed, in Huntington Beach. It was a 2/2 offered at $100K. No one was buying these and the median incomes were in the $30K range.
I still contend it is all the great unknown, fiat money. It has always ended in economic ruin, but the charade goes on. Market rallies because debt crisis in Europe abated? With more debt? That’s abatement?
We are all mistaken thinking in terms of tangible quatification of economic parameters. We are on the twilight zone train, where dimensions are distorted, time and space are altered, goverment statistics are meaningless. If you pour the kool-aid, they will drink it.
We have resorted to robbing people to pay Paulson. It’s just a matter of time before this train comes off the track. All we can do is try to remain grounded and cling to the tiny sliver of reality left for us. Places like here, where the wheat is seperated from the chaff…The dark ages lasted over 500 years. When this breaks it won’t be fixed in our lifetimes.
“There is a fifth dimension beyond that which is known to man. It is a dimension as vast as space and as timeless as infinity. It is the middle ground between light and shadow, between science and superstition, and it lies between the pit of man’s fears and the summit of his knowledge. This is the dimension of imagination. It is an area which we call “The Twilight Zone”.
Chris, the only way out of this is inflation. Inflation is not just the unfortunate consequence of the flawed monetary policy which leads to indebtedness in every corner of the economy, but it is the solution to this mess. As such when it starts to pick up speed the government will play fool like they don’t see it, they don’t understand what is coming in order to let it pick up steam. After that moment we will be following the events not be owners of our economic destiny. In order to get to this point FED will be asleep when is supposed to raise the interests rates (to a level to prevent the hyperinflation). They will pretend that they don’t know what is going on, but actually will be plan to let hyper inflation run and flush the system of its indebtedness, which is inheritance from the flawed economic policies starting from Reagan time. Inflation will wash out all the debt – state, federal, household and corporate and then rinse, repeat again.
We are in a somewhat artificial situation. If the $ were not a world currency, I would expect the drunken spending (without concomitant productivity) represented by the Consumption Economy (that’s right — ‘consumption’, as in tuberculosis) over the last decade would have resulted in a Reich style inflation.
The amount of debt is just staggering; inflation will hit us hard eventually — just when, who can say? My timing talents have not been worth much up to now. The cheap availability of oil and automated manufacturing have to be factored in somehow — maybe we can continue to live high — at least until the oil stops flowing.
There is no housing bubble. Home prices have increased every year since the War of 1812. When you buy a house, you get capital appreciation, hefty tax deductions, and the pride of ownership. However, you have to buy now. This very second because with prices rising so fast you might miss your chance forever. You see, the nation is flooded with illegal immigrants who are buying real estate like mad. Enviromentalists won’t let any new houses be built so supply is not increasing. Speculation? Nonsense. Unlike the stock market where investors can load up on shares, real estate is lived in. In fact, in a 100 unit condo development, the owner lives in each unit so there is no chance of a bubble forming. In the history of the USA, nobody has ever speculated in real estate so this is a 100% safe, sure fire thing. But you have to act now. Please call Kuntrywide today to purchase your share of the Americun Dream.
Chris, you are absolutely correct; we can study an issue and make logical conclusions, but that doesn’t mean the market will behave according to logic. Remember, John Maynard Keynes said “the markets can stay irrational longer than you can stay solvent”.
Now, here is my way of thinking. I believe that we are headed towards a second leg in this economic depression. We already saw the first part play out in 2008 and just like in 1929 the government responded by providing stimulus. This is just like 1930 in which the second leg of the downturn will devastate our economy.
In the end, there is only one way out- allow the deflationary forces to take it’s shape and ultimately reward the savers and producers of this great society.
@Kunt
You’ve got me sold! What’s the number?
I don’t think there is enough money or the will for a second stimulus. Should be interesting to watch the next round of price drops.
Increasingly it is starting to mirror the great depression. Especially the behaviour of the stock markets. This just might be one long, slow, painful adjustment.
Michael – 3.8% on home sales for wealthier individuals in certain situations where it is investement income, but it only kicks in if the _profit_ is $250,000 for a single person, $500,000 for a couple filing jointly. It will likely affect less than 1% of home sales.
Kuntrywide: Thanks for this once in a lifetime opportunity, won’t last long please save a spot for me I am always looking for a sure fire investment, so my check is in the mail!
Here in the PNW, a lot of logs are going directly from the rainforest to China via our strong system of marine transport. Plans for Columbia River and other new or expanded marine transport terminals are underway. Meanwhile the consumer price of lumber right here, where forests are what we gots in spades, is skyrocketing. The same loggers who were out poaching spotted owls and shooting hikers 15 years ago now realize they bought into the New World Order and their new chains: resource serf.
~
The thing I find most disturbing about all this is that, by not allowing the market to take care of high prices and bad loans, a lot of us are stuck in formerly sustainable and solid neighborhoods with a bunch of yahoos and meth-heads who won the Countrywide “fog the mirror and win a house” lottery. Between that and Section 8 renters dragging formerly solid housing into piles of crap, even if responsible home owners managed to keep themselves clear of greed, they’re being dragged down. This Superfund model of real estate has to go, but since fiat currency and Growth Uber Alles is the problem, how can it?
~
Doc, a note on the eroding equity thing. Some of that has to do with downward assessments. Our house was assessed downward 25%. I wasn’t sorry–it was inflated ridiculously and so were the taxes. But it means that even though we are in a stronger savings, debt, and work position than 10 years ago, by far, we appear to be in worse shape because our debt-equity ratio has shifted. (Our only debt is a mortgage of about 1/3 the new equity; previously it was closer to 1/4.)
~
rose
According to foreclosure.com, there were 1040 new NODs issued this past week in San Diego County…more than double the 492 issued during the previous week and nearly double the 536 issued the week before that.
However, there were only a total of 36 foreclosures in SD County during these past three weeks.
Clearly, the banks have practically given up on further foreclosures. I guess there muct be a lot of squatters in San Diego these days.
Doc,
Love the Texas ratio chart. Having lived through the Texas experience at the end of the 1980’s it brings back fond memories of closed banks, homeowners walking away from unsustainable home loans because of lost employment, home prices dropping 40% and sellers being very very nice to anyone looking to buy a home. It only took 20 years for prices to come back to their 1988 values. Many, many people got locked into their homes for a long time. Ahhh, the good old days.
Thank you for this great piece. Very thorough, though I also find it very discouraging.
Can you please revisit what is really happening with American banks right now (mid 2010)? They look great from the outside and with their stock prices doing fairly well, but everyone knows that they’re so sick with cancer on the inside it’s as if they could drop dead at any moment.
More importantly, how much longer can this extend-and-pretend-business with shadow inventory, REOs and squatters go on? A decade? Longer? It seems to me that banks are feeling zero pain for their failures, and facing zero ramifications from stock holders.
At some point these REOs have to be sold or bundled up and sold to a third party (not a bank, hedge fund), am I wrong? Prices for SFH homes are still way too high in many parts of Orange County given current net incomes and inventory of SFHs remains incredibly low. Whenever a house is released for sale in south OC, it’s bought up and sometimes bid up well above asking price. With some REOs, I’ve observed banks rejecting lower price offers easily and with confidence because there are almost always multiple high priced offers they can turn to in order to mitigate their losses better. There seems to be a never-ending supply of greater fools.
As sick as these banks may be – and I think some are on gurneys with tens of thousands of REOs just sitting there – they still appear to be doing a pretty good job of controlling inventory, pricing and preventing dramatic losses in OC.
Thoughts?
@Markus Arelius
Last night in OC a father shot 3yrs old three times and 5 yrs old escaped before the couple committed suicide. 3 yrs old was bleeding for 12 hours before someone called 911 and survived. It appears to be a financial crisis (FORECLOSURE).
1. I worked hard for last 10 yrs and saved enough money and I still can not afford a house.
2. People who baught house in 2004-2007 can not afford that house .
So we all are loosing…………………but someone is winning….. figure it out guys.
100 unit condo complex and its all owner occupied?…never seen it…..in fact most condo complexes are hurting so bad right now due to unpaid assessments and high foreclosure/short sale rates; its not funny! …your comment is hilarious there is no bubble~look at the graphs to see the bubbles…plain as day…unless your blind…also learn how to spell~
Leave a Reply