
The Rise and Fall of the Southern California Housing Empire: Foreclosures, Bad Investments, and Psychological Deception.
Mighty kings rise and fall like the sun. Southern California decided to take an ancient recipe from the books of history and followed in this time honored path. Except our king came riding in on a pair of 24 inch spinning rims in a Cadillac Escalade. The only problem is all of it was mortgaged on a kingdom of sand that is now quickly eroding. For anyone in Southern California the minor consolation we can take is that this will go down in the history books of financial exuberance like those who lived through the Dutch tulip mania in 1637. Tulip contracts were selling at 20 times the annual income of a skilled craftsman. Remember the story about a farm worker who made $14,000 a year and was able to buy a $720,000 home back in May of 2007? Why stop at a 20 ratio when we can go over 50 times?
Now this is the story of glamour and glitz. The rise and fall of a housing market in a few short years. In today’s article I am going to use graphs and data to try to examine the Southern California housing market. I have been covering the housing market since 2006 in the heat of the insanity and the psychology now is incredibly different. Prices declining by 40 percent in one year will do that to you.
Southern California according to DataQuick reached a peak median price of $505,000 in July of 2007. Since that time, the median price has fallen to $300,000. Keep in mind the median household income for Southern California is under $50,000. So at the peak, it would take the median household income 10 times their annual earnings to purchase a home in the region. 20 times for a tulip contract, 10 times for a glorious shack. We will now have our place in the history of magnificent bubbles right their next to the tulip bulb mania from 371 years ago.
So let us get to work since we have a lot to cover. First, I have compiled a chart showing the median prices for each county in Southern California since the start of the decade. I have yet to see a chart break out the counties individually like this so the chart should provide a fresh perspective of the data:
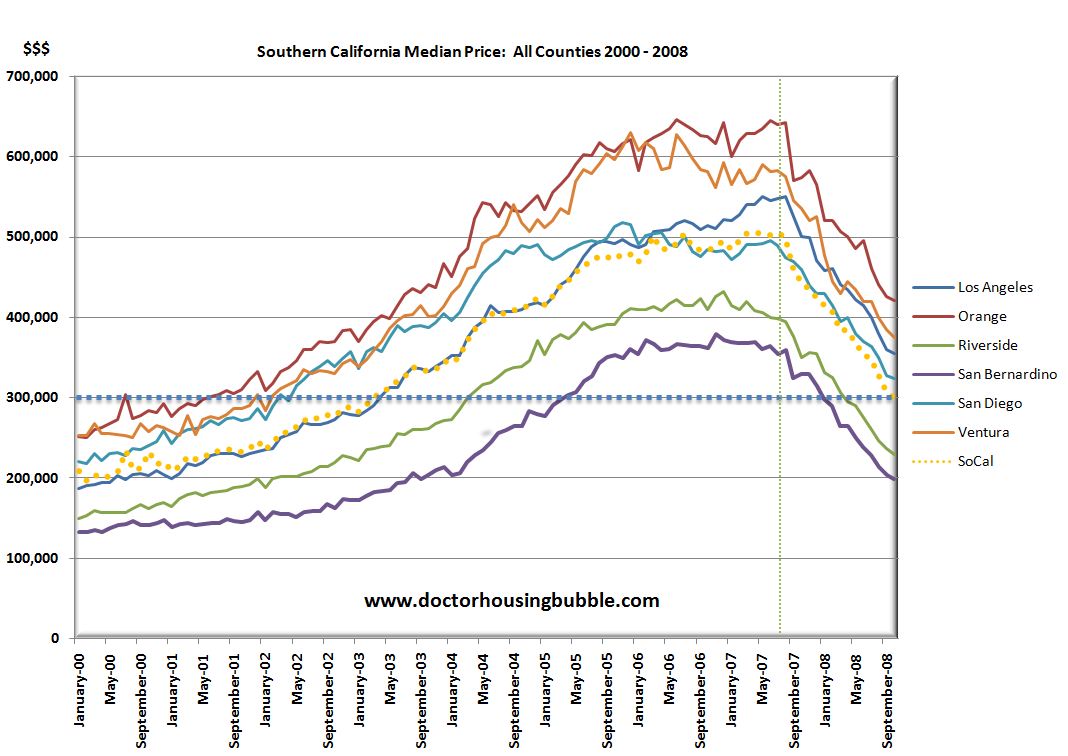
(Click for a sharper image)
As you can see from the chart, the pace of growth for the entire region was uniform up until the summer of 2007. Like a plateau, we hit a steady pricing trend from 2006 to 2007 before falling off the cliff. The dotted yellow line is the aggregate of all counties in Southern California. Many counties are now back to 2003 price levels without adjusting for inflation. Given the last few months of data, we are looking at least in the short term to heavy and strong deflation in practically every investment vehicle on the market. What this means is price drops are even worse than they look.
What else can we learn from the chart? Without prejudice every region rose at nearly the same pace. This is the stunning thing to notice when you break the data out. Every upward county trend in the chart above shows a similar movement upward. It didn’t matter whether it was Orange County or San Bernardino, the bubble took hold of each county. The actual nominal price peaks for Orange County and Ventura are simply stunning.
The next chart should sum up nearly an entire decade of housing mania for the region. I’ve put together a chart showing the median price for Southern California and the monthly sales for the region:
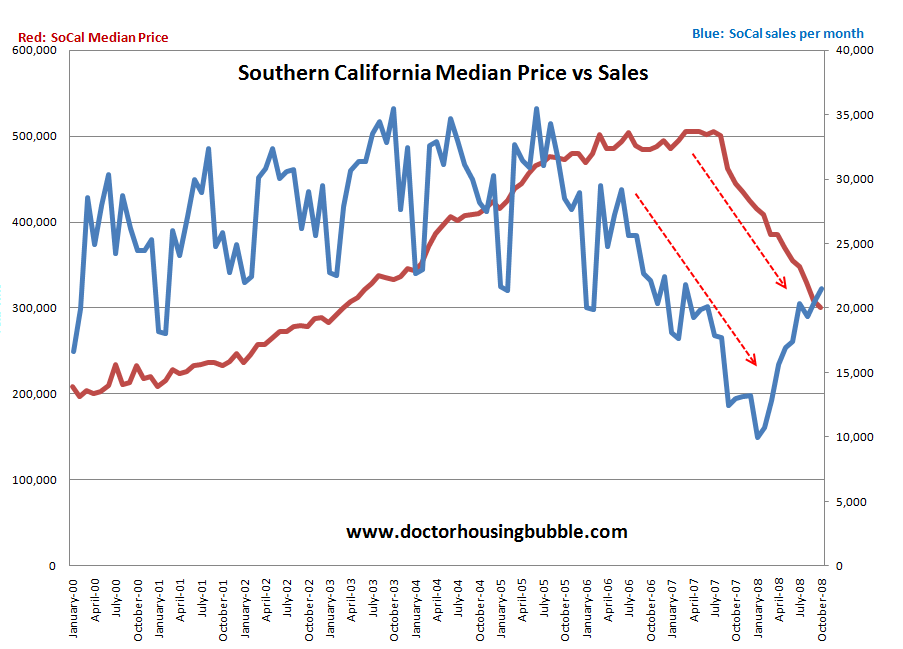
A couple of things I want to highlight first. You will notice that for sales, there is always a seasonal drop in the winter and peak in the summer. That is typical. It goes up and goes down based on common real estate sales patterns. Why? Many people move during the summer season and most people buy homes during their “family forming” years so pulling a kid out of school isn’t the smartest move. In addition, many people buy homes who are planning on having a family so in general it causes an upsurge during this time.
What you’ll notice that since 2000, the troughs were higher during the winter and the peaks were stronger in the summer all the way until 2006. That is the first time the summer bounce wasn’t as strong as it once was in the heat of the bubble. It is also the time when you see the median price plateau. Once this happened, it took about one year for the entire market to collapse and as you can see above, both prices and sales fell off a cliff.
So why are sales now moving up? Simple. Prices have gotten cheaper. Drastically cheaper. Even with the amazing upsurge in sales, you can see that we are still very far behind the curve from the bubble days. Keep in mind we are now entering the typical slow season of winter so it will be interesting to see what happens here. I maintain that housing prices for Southern California will not bottom out until 2011. Now sure, we may hit a bottom in price in 2009 or 2010 but that price will probably be the same in 2011. The problem with finding the bottom is you won’t know until maybe one year has passed. But when bubbles burst, especially one this size that has caused so much financial trauma, we will be swimming in scuba gear near the bottom for a few years.
Most kings have a sense when they are facing trouble. In most cases, a king won’t look out his castle’s window and see thousands of angry peasants with pitchforks and say, “wow, I didn’t see that coming!” We have many early warning signs. One thing that is simply laughable from the mainstream media is when they say, “no one can possibly have seen this coming.” Well many economists, bloggers, and some politicians saw this coming so there goes that “no” one argument. In many cases, that is why many media outlets are slashing and burning staff because how can they claim to be credible when many independent sources have done the research they didn’t and have issued many siren calls in the past? Many readers are smart enough to see who is credible and who is simply playing catch up. Why pay a writer a high six figure salary when a blogger knowledgeable in the subject is already writing about it?
What was one thing that was missed that approached like an angry mob screaming and chanting? Notice of defaults and foreclosures:
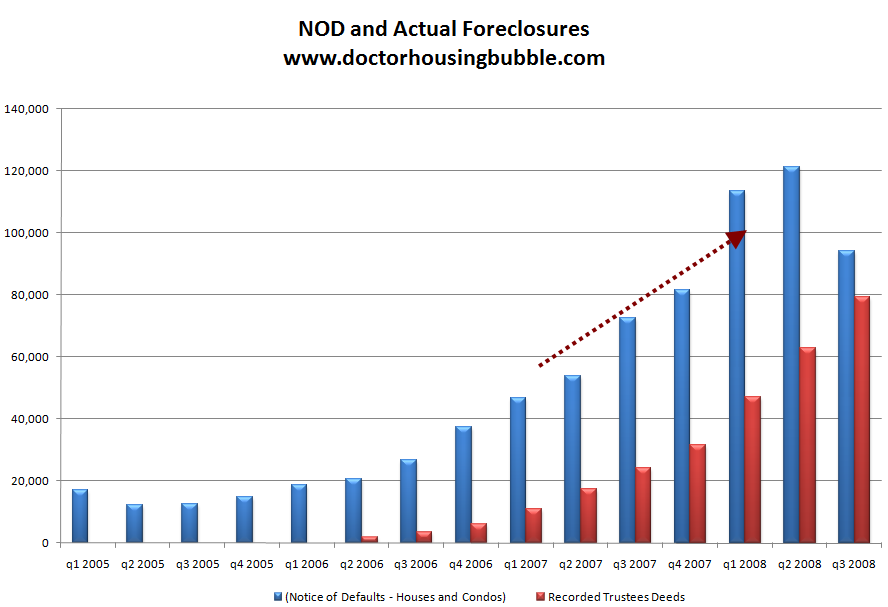
Take a look at the chart above very carefully. You notice that tiny red sliver of foreclosures in Q2 of 2006? That was the wake up call. These foreclosures were probably the most egregious fraud cases because look at the peak prices above. Practically anyone could sell a home at peak price with little work. After this point in 2006, a trend was noticeably appearing. No one saw this coming? Maybe they didn’t but many who actually understand these trends tried to echo a warning but bubbles are hard to burst. It is like the party with no parent and the punchbowl needs to be taken away because people are way too drunk. Who will be the one to end the fun? You would hope that regulators such as the Fed or our government would have something to say but instead, we have Alan Greenspan saying how fantastic adjustable rate mortgages are! So that has already passed. Yet the problem is they are still doing the same mistake! How so? For example, during these last few upsurges in sale they made it appear that it was somehow a gigantic jump. No, if you pulled data back from 2000 where the bubble started, you would quickly see the “upsurge” was simply a trend back to normalcy.
You’ll notice with the above chart that as time went on, many of the notice of defaults (NODs) started going into foreclosures. This is significant. If you look at say Q1 of 2005 we have nearly 17,025 (NODs) but practically no foreclosures. Why? Anyone in trouble can just sell their home. Simple. Not the case anymore. You may be wondering why NODs suddenly fell off in Q3. This as I have stated is because of SB 1137 which is simply a dull legislation requiring lenders to kick the can down the road a few more months. It basically tells lenders, “hey you. Contact the borrower and tell them what’s up. Now go forth and collect.” Yet how are you going to squeeze cash out of a cash strapped California homeowner? That is why each subsequent bailout gets dumber and dumber on an exponential scale because consumers simply are financially strapped.
Another key chart to look at is the median price versus the California unemployment rate:
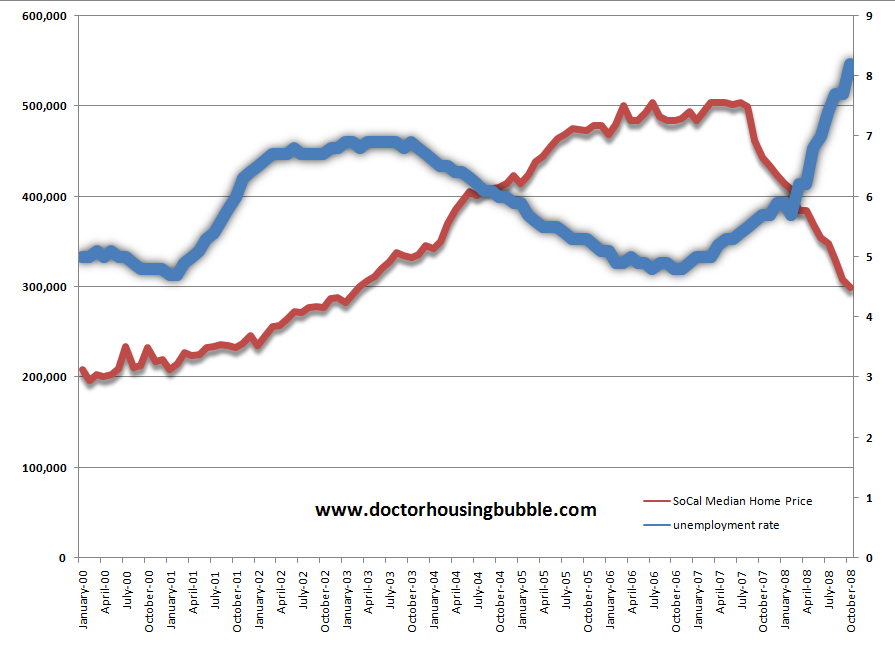
What you’ll notice almost perfectly is the unemployment rate dropping sharply right at the peak of the bubble. Right when the bubble burst, you see unemployment rising sharply. So what came first, high unemployment or the peak price? No need for a chicken or egg debate but let us point out the obvious. First, you’ll notice that once the plateau of peak prices was reached it stayed high into 2007. Unemployment started creeping up in 2006. Why? Well many builders were getting out of dodge while the going was good while many people were still pretending they lived in Wonderland hoping a borrower would jump into the rabbit hole and pay their outrageous price.
This above chart is crucial since the trend is almost perfect now. That is, higher unemployment will lead to lower prices. That is normally how housing markets play out during tough times. This case is unique in that California built an industry around this bubble with construction, finance, home building, equity withdrawals, and industries that catered to the housing bubble. Now that the bubble is gone there isn’t enough other jobs in the non-bubble economy to absorb these people back. That is why I just don’t see how California gets out of this bubble until 2011. Maybe nationwide we may see a price bottom in 2009 or 2010 but certainly not for us.
The above charts paint a rather clear picture of the longer term trend. But how are things today? Well let us look at the current market snapshot:
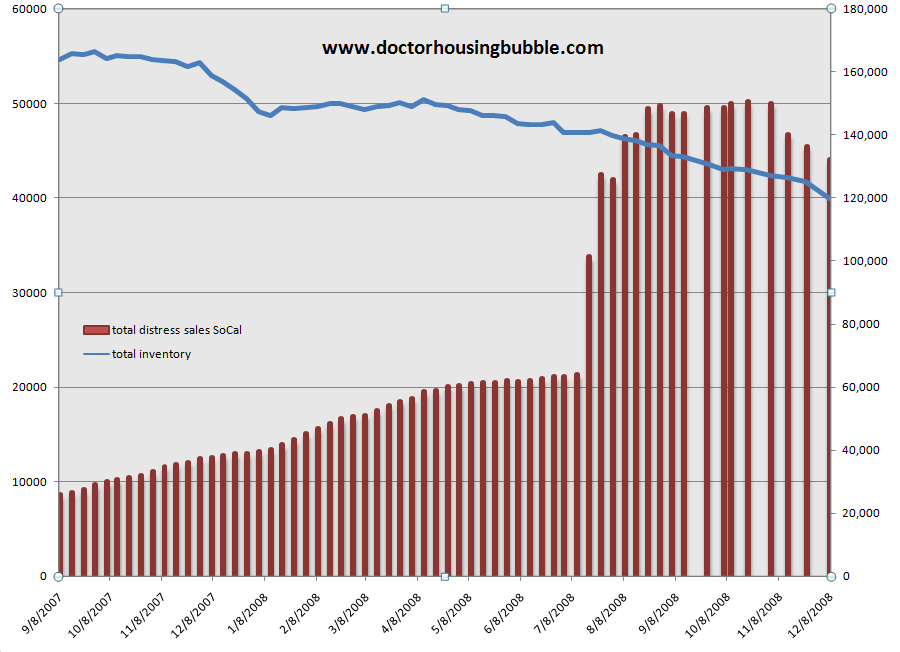
This next chart has data from September of 2007. You’ll notice an upsurge in July of 2008 but you should ignore that because I added San Diego county distress sales at this point. However, the trend is unmistakable. Inventory is falling and distress sales are rising. The only reason you have seen then taper off recently again is because of the legislation. But even then, you can see how tiny this is even when it is simply pushing problems 1 or 2 quarters away.
This chart also shows that psychologically those that do not need to sell are pulling their homes off the market. Why in world would you sell right now? This is a horrid market. Yet, waiting until a few months down the road you may actually lose even more. Think of it this way. The chart with price above shows massive gains since 2000. That is across all counties. A high percentage of people that own bought before this time so they would still make a profit today. Now you have people willing to wait hoping next summer the bubble makes a triumphant return. Or you can sell now. This chart above tells you one major thing. Many think they’ll be able to get higher prices tomorrow. Yet distress properties keep hitting the market because these are forced sales.
I hope the above gives you a deep perspective of Southern California and hopefully provides you some insight in where we are heading. We haven’t seen this kind of economic turmoil since the Great Depression so it is hard to say when we will bottom out. Yet one thing is certain and that is we are going to go down in the history books for generations to come right next to those beautiful tulip bulbs.
 Did You Enjoy The Post? Subscribe to Dr. Housing Bubble’s Blog to get updated housing commentary, analysis, and information.
 Subscribe to feed


20 Responses to “The Rise and Fall of the Southern California Housing Empire: Foreclosures, Bad Investments, and Psychological Deception.”
DHB, your posts are great! I have been reading for about a year. I rent in Newport Beach, and was wondering if you could weigh in on what gives in my current neighborhood. It’s a nice neighborhood, but not spectacular. Sure, it’s within a mile or so of the ocean, but there’s no ocean view to be had. The odd thing is that I keep reading your posts and others like them, but I am not really seeing it much in our neighborhood. Definitely there are no visible increases in pricing, but inventory is low- -probably b/c they can afford to not sell right now, for the most part. And there are some signs of hurting- – one house on Basswood, a 5-BR, has come down a few hundred thousand and I think it’s below what they paid for it. It’s been on the market a long time but still no takers. But I still see the Surterre realtor folks pricing for the sky, acting like it’s June of 2006. One came on the market in the last 60 days at 1.749 mil. (2351 Aralia). It’s a flipper (recently they FINALLY put some grass in!), and it backs to a busy street right across from the high school. Yet they still think it’s close to 2 mil. (agent must have access to good weed!). It’s not selling. But I have to say that this area still has not seen the price drops like so many other areas. My question is this: should we ever hope to see a return to fundamentals in this area, or are they going to stay too expensive for even people like me who have 500K to put into a house and a rock solid job, credit, no debt, etc.?
Great presentation! Hopefully things will turn positive as consumers and investors realize how undervalued so many properties are. Dropping interest rates won’t hurt either.
Newport Renter,
You cannot time a bottom. A bottom occurs and then prices move up. My suggestion to you is simple. Wait until you find a house that you can afford. By afford I mean that you will seek a mortgage that is no more than 4 times your annual income. So if you are making 100000 and can put down 100000 then buy a house for no more than 500000.
Eventually the prices in Newport Beach will come down because there will be a serious lack of demand based on prospective buyers inability to sell their own homes.
Remember that 300 billion of ARMS are readjusting in California in 2009. It will be walk away time and Newport will be hit.
Good luck.
Dr. HB-
Another great post. I think it’s important for your readers to know that a 2011 bottom is a best-case not a worst-case scenario. We don’t want Newport Renter thinking he has to rush in once January, 2011 hits.
One of the things that may help for those trying to time a bottom would be to watch stock charts of the Homebuilders (e.g., the $DJUSHB index), as these should bottom out and begin a solid uptrend at least 6 months before the true bottom is in. I would say that once this group of stocks has had a solid one year bullish uptrend, it is close enough to a bottom where you won’t regret buying.
To make matters much worse, unemployment will continue to skyrocket and further exasperate the decline in housing. I foresee housing declining to levels back to mid-90’s.
Don’t be surprised DHB because .gov is doing everything it can to keep these prices propped up. I don’t see a bottom until 2012. It’s kind of scary because isn’t 2012 supposed to be the end of the world according to the Mayans.
Ok Newport Renter – Here is a story form LA Renter (for the last 10 years!!).
My husband and I have been wathching the real estate market (in the decent ares of LA and the OC) for the last 5 years. We are two working professionals (with a 2.5 year old). We are highly educated and combined we make around $200k per year. Neither of us had any financial assisitance (other than student loans with high interest rates from the government) while in school and we do not have any contribution from family for a down payment. All of our student loan debt is payed off and at present both of us have credit scores over 800, plenty of savings in the bank and pre-approval to buy. We are both between the ages of 35 – 40. So what are we waiting for??
A FAIR PRICE!!!!!!
The closest we have come to purchasing a home is when we made an offer on a home in West Floral Park (Santa Ana). There is a home at 2337 Lowell Ln, Santa Ana which is still on the market for $739k (for 70 Days) which we made an offer for $629k when it had only been on the market for 14 Days. They countered back with $731,240 (you can get more research on this property through Redfin or Zillow). With the ridiculous # they countered back to us with, we felt it was important (at least my husband did) to write them a letter stating our position. We knew that even offering $100k under asking price we were still going to lose at least $150k in equity within the first two years of “ownership”, but we felt being close to family was worth the loss in $$.
My husband’s brother lives very near to this home and after speaking to the owners he was made aware that if they could not sell now for the price they thought their home was worth (even though the 2007 peak value was based on monopoly money) they would just wait for the next peak. They are in their early 60’s and have two daughters with six young grandchildren all living in Laguna Nigel (which is why they wanted to sell – to avoid the 45 minute commute to help with the grandchildren). But they truly think that the market will change soon… We do not think the $ amount they are asking on the home now will be possible for at least 15 – 20 years!
I feel that the only way to drive down prices faster is for all of the qualified buyers like my husband and I to DEMAND lower prices in areas where the demographics say we “should” be able to live! Unfortunately, I still think there are many takers for the “carrot”. This has been the case for the last 8 years. Maybe things will change this year…
Realistic but Hopeful, RL
I don’t understand. How come with 200K incomes you go and buy a house in Santa Ana? Why? Why 630K is a good price where the school report and demographics tells you “quazighetto†? If there is people, who think themselves responsible which buy for $630K in Santa Ana why not prices for Santa Monica – cheapest 2 bedroom, price tag $1100K. Why not? Get serious!
Thanks for the ideas folks. Our son goes to CdM high and we have beenr enting in the area for two years. We’d like him to finish at the same school. With a down of 400K (saving 100 for rainy days) and an income of 155K (no debt, paid off student loans, cars paid for, no family money – -the 500K was all sweat!), we would like to think that we could afford the 3BR 2BA house we live in (renting). But with prices the way they are, still not enough of a drop here. Hopefully time will produce some declines here! If not, we’ll move after he finishes high school (2012) and build a nice place somewhere affordable. Here’s to Plan A!
In the words of Will Smith: “Damn”. The death spiral is accelerating.
I love this site and all the information. I do have one question: where is the best place to find information about the median income of a particular county?
I am getting ready to move to FLA this summer and we are looking to buy a house there.
Thanks,
Mike
@tony: Actually, the traditional income/mortgage ratio is between 2 and 3 (I usually use 2.5,) not the 4 you stated.
~
Wonderful post. Great charts. Presents a clear picture of this mess — this is what the media should be using instead of their lame expert commentary that fails to look at the big picture.
Thanks for the post Doc.
>
Why do we continue to beleive and support these people running our government? They are either lying to us or are incredibly inept.
Ben Bernanke last year:
“We will follow developments in the subprime market closely. However, fundamental factors—including solid growth in incomes and relatively low mortgage rates—should ultimately support the demand for housing, and at this point, the troubles in the subprime sector seem unlikely to seriously spill over to the broader economy or the financial system. “
Dr. H.B.,
I must say that this is one of the best sites that I keep coming back too. Very well researched and I’ve been visiting for well over a year. I have a very dumb question. My wife watches a show called “Million Dollar Listing” on Bravo. Well, since I read your stuff, I caught the tail end of one show. I then backtracked and watched several more shows. My question is, How can these “Brats” sell these high priced real estate when I thought that the overall market is falling. Is it just “TV/Moving pictures”? or are the high priced footprints actually holding their value? One more thing, these guys on that show should try to sell a house in Cleveland, Ohio to really show “Their stuff”! LOL
This income/mortgage ratio 2,3 or 4 depends a lot where we are talking about. In Jacksonville, FL at the height of the bubble was 4 and for Los Angeles at bottom of the last cycle was 4.8 ( at 2006 peak was more tan 10 ) . In LA ratio has never been just 4. Never. But even 5 for LA means median price of 5 x 55K (median income) = 20% down payment = 300K, approximately. It means on average we are there but it is due to already undershooting in the slumps and the beaches and west side has barely moved. Woe to those fools that think it is over in Newport Beach and Santa Monica. Don’t get fooled. Just watch what may look like a bottom and jump. It doesn’t matter you can or you cannot afford it. If you have been waiting like me you ought to see the bottom of it. Still too early for me.
Hey, DHB, those spinning rims are little suns…and did anybody besides me ever see the word “Escalade” and remember Tom Lehrer’s reference to President Johnson “practicing escaladio”?
~
That’s what we’ve become. Escaladio Nation. More more more (howdayalikeit howdayalikeit).
~
I was thinking about the now deflated notion that the US economy is decoupled from the global one. There’s an element to this crash that isn’t getting much airtime outside of Doc’s columns: how California’s economy is connected to other regional ones.
~
An example of this is Californians who profit from gentrification (fat salaries) and housing bubbles, while complaining about what accoutrements they can’t afford. Then instead of sticking it out and working to make their communities more sustainable for everyone, they bail for whatever other part of the world looks cheap and good by California Life Style standards. Thus a) removing billions of dollars from the economy that enriched them and b) exporting their gentrification culture to the modest hometowns of those of us who still have to work for a living, and can never hope to save $400K on our US median salaries.
~
That is, in essence, the California Dream. A gold rush. All well and good. But when Californians move to other communities with their fat wallets, all they do is recreate gentification. Though of course their goal is to be on the TOP of that process, not its victims. The victims? Screw ’em, they should’ve skimmed some Golden State cream.
~
Here’s something for y’all. Google or other search on the phrase, in quotes, “efficiency is intelligence.”
~
ZERO HITS!
~
rose
California to have $41.8 deficit by 2010.
http://www.msnbc.msn.com/id/28179777
1929 Liquidate everything, sec. treas. Mellonhead said
Toluca Lake hasn’t got the memo:
http://listings.listhub.net/pages/SOCALMLS/F1792521/?channel=zillow
Over $800/ sq. ft. for all that 1949 AND LAUSD goodness!!!
Leave a Reply