
California Housing Inequality: Top 4 and Bottom 4 Zip Codes in Los Angeles California. Foreclosures and Zip Codes do Matter.
I was a bit surprised this week when I saw some positive spin being thrown out regarding the Case-Shiller Index. Even though we have dropped into record territory once again, the new Laundromat spin is that the drop was not as bad as previous months. This is like telling a person who just jumped off a 100 story building that zooming by the 50th floor is much better than going past the 73rd floor. The end outcome is inevitable and this desperation to spot the bottom is like those who desperately want to find Big Foot. The bottom will come but not today. The bottom won’t arrive tomorrow. It will be years before we ever recover from this decade long credit and housing bubble. That is the plain and simple truth. I have detailed 10 reasons why there will be no second half recovery for the United States. I’ve also talked about 10 reasons why California won’t see a bottom until May of 2011.
Right on cue like a booming orchestra, the FDIC mentions that it may need to tap into the Treasury. This after banks reported record low profits in the second quarter and the list of “troubled” banks grew from 90 to over 115. Keep in mind back in March the FDIC had a list of 90 banks with a total affected amount at $28 billion. Well now fast forward five months, and the list has grown to 117 and the affected amount has grown to $78 billion. This is a “tiny” problem given that the FDIC fund only has $53 billion at hand. Oh, and one more thing. As it turns out, it may cost a little bit more money than previously expected to bailout uber bank failure IndyMac.
Keep in mind that when a bank fails, the FDIC needs to sell off assets to other banks. Other banks that are probably just as screwed up as the current bank that got taken over. Maybe they took a deeper look into the portfolio of this California based institution and realized most of their assets are now located in a state that has seen a 40% median price drop in one year! That is right folks, this week the California Association of Realtors came out with their monthly report and we have now crossed the 40% year over year median price drop for the entire state. Can it be that some of those assets on the book are simply not worth what they once said they were worth?
So now, not only do we need to contend with Fannie Mae and Freddie Mac and their inevitable bailout but we now have to watch over the FDIC and their creep into the U.S. Treasury because of all the bank failures that will occur. Is there really any doubt that we will continue to see more bank failures? IndyMac, one of the largest bailouts in the history of this country wasn’t even on the FDIC watch list! Now that the FDIC is running the show, they realize that it is going to cost more than their worst case scenario. These are the folks who supposedly know what they are doing. And to think that one of their ideas was to lower mortgage rates to 3% on 25,000 IndyMac customers who are delinquent on their mortgages.
Should we be concerned about this? I think over at Global Trend Analysis there is an excellent summation of this problem:
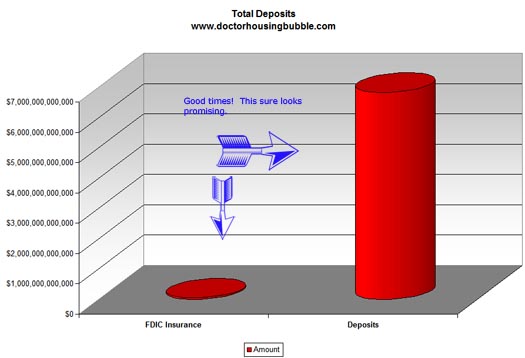
“(Global Trend Analysis) 24. There is roughly $6.84 Trillion in bank deposits. $2.60 Trillion of that is uninsured. There is only $53 billion in FDIC insurance to cover $6.84 Trillion in bank deposits. Indymac will eat up roughly $8 billion of that.
25. Of the $6.84 Trillion in bank deposits, the total cash on hand at banks is a mere $273.7 Billion. Where is the rest of the loot? The answer is in off balance sheet SIVs, imploding commercial real estate deals, Alt-A liar loans, Fannie Mae and Freddie Mac bonds, toggle bonds where debt is amazingly paid back with more debt, and all sorts of other silly (and arguably fraudulent) financial wizardry schemes that have bank and brokerage firms leveraged at 30-1 or more. Those loans cannot be paid back.”
Bwahaha! The FDIC with only $53 billion, with a large portion being eaten up by Indy Big Mac Attack has to cover an additional $6.84 trillion in deposits. Who would have thought the FDIC was also in the maximum leverage game?
Just to give you a nice little visual of this, let us put this on a chart:
Â
Now some of you may be furious and irate about this but really when I look at this and understanding all the data that we now have out, the money is simply not there. I mean there are a handful of banks larger than IndyMac that should they fail would wipe out the entire fund in one movement. We are teetering on that edge and have been for a long time. Our only option is to tax the American taxpayer which if you haven’t noticed, is having a tough time as well. If we print money which we will have to do, we run the risk of fueling inflation. This does not bode well for the dollar.
Yet this pain doesn’t impact everyone equally. I think you’ve come to that conclusion on your own that some of us don’t have the luxury of golden parachutes like many in our society. So today, we are going to look at 4 of the hardest hit zip codes in Los Angeles County but also 4 of the most affluent who are pretty much oblivious to what is going on around them. Let us now look at some discrepancies that are as large as the chart above.
Bottom 4 Zip Codes
You may be surprised that in Los Angeles County with 10,000,000 people, 88 cities, and 270 zip codes that there are now 8 zip codes with a median single family home price under $200,000. Â This is now below the national median home price and right in Los Angeles County. Â Many of these areas have been hit the hardest over the past year during the housing decline. Â Let us take a quick look at the four lowest priced areas in L.A. County:
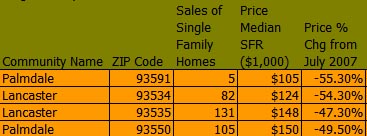
In the most northern tip of the county you will find Palmdale and Lancaster. Â For the most part, these areas are far out from the hub of central Los Angeles yet appreciated during the boom with all the vigor of all the other cities. Â As you can see from the velocity of the change in price, these 4 zip codes are now down by 47 to 55 percent in one year.
These areas have also seen a spike in sales recently given the massive discounts that are hitting the area.  Many people are now jumping back into the market with prices of $105,000 to $150,000.  It was always the case that many people who wanted a piece of the American dream but could not afford to live in more expensive areas of Los Angeles would make the long and arduous commute from far and away.  The incentive was lower priced housing. At these prices, it may be the case that many people are now jumping back into this tradeoff.  That is, owning a bigger more affordable home while bracing for a tough commute. A $100k home may be that incentive.
The challenge with the Inland Empire which is also seeing a bump in sales is that prices hit astronomical highs up to $500,000 to $600,000 for some of the new developments. The commute for these people simply didn’t make economic sense and that is why these areas face pain for a much longer time even though sales are jumping. If you want to see what kind of prices are moving homes in Southern California just look at these areas. People will buy at the right price.
Let us now look at the top 4 zip codes in Los Angeles.
Top 4 Zip codes Â
The top 4 zip codes in Los Angeles County don’t even realize a housing decline is occurring. Â In fact, they are still on their upward movement and are still enjoying double digit appreciation. Â Let us now take a look at these top 4 zip codes:
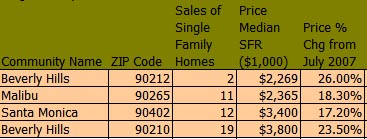
The median price of the top 4 ranges from $2.2 million to $3.8 million. Â These areas are up in their median price from 17 to 26 percent on a year over year basis. Â Yet these areas have much fewer sales thus not making that big of an impact in the overall median price. Â This is one of the arguments that bottom callers are currently pointing at. Â Too bad most people live in areas that are hardest hit.
Let us take a quick population count for these zip codes:
Top 4
90212:Â Â Â Â Â Â Â Â Â Â Â 11,632
90265:Â Â Â Â Â Â Â Â Â Â Â Â 20,107
90402:Â Â Â Â Â Â Â Â Â Â Â Â 11,313
90210:Â Â Â Â Â Â Â Â Â Â Â Â 21,934
Total:Â Â Â Â Â Â Â Â Â Â Â Â Â Â 64,986
Bottom 4
93591:Â Â Â Â Â Â Â Â Â Â Â 8,466
93534:Â Â Â Â Â Â Â Â Â Â Â Â 39,984
93535:Â Â Â Â Â Â Â Â Â Â Â Â 59,245
93550:Â Â Â Â Â Â Â Â Â Â Â Â 83,994
Total:Â Â Â Â Â Â Â Â Â Â Â Â Â Â 191,689
Keep in mind that out of 270 zip codes, only 8 zip codes (including the 4 above) saw year over year increases in price. Â Let us look at the additional 4 zip codes that saw year over year increases just to get an actual number of people who saw year over year gains:
90024: Â Â Â Â Â Â Â Â Â Â Â 44,578
91105:Â Â Â Â Â Â Â Â Â Â Â Â 9,898
90293:Â Â Â Â Â Â Â Â Â Â Â Â 11,535
90040:Â Â Â Â Â Â Â Â Â Â Â Â 10,044
Total:Â Â Â Â Â Â Â Â Â Â Â Â Â Â 76,055
Total population in Los Angeles County who saw gains last year:Â Â Â 141,041
That’s right folks. In a county with 10,000,000 people only 141,041 saw a positive gain in their real estate.  And we are to believe that the numbers are being skewed by a few people at the bottom?  The fact of the matter is 262 zip codes actually saw year over year declines last year.  The vast majority of people are feeling the pinch of this housing market except for a small number of people. The 90040 Commerce is an anomaly because only one home sold last month but the other zip codes are prime $1+ million areas with only a small number of sales. Yet we are to believe that a small subset is skewing the facts.
Time to refocus what is really going on. The majority of sales are distressed properties and more and more areas are being brought down by the current market. These are facts that simply cannot be refuted. Unfortunately not all of us live in Malibu or Beverly Hills like the bottom callers want you to believe.
 Did You Enjoy The Post? Subscribe to Dr. Housing Bubble’s Blog to get updated housing commentary, analysis, and information.
 Subscribe to feed


7 Responses to “California Housing Inequality: Top 4 and Bottom 4 Zip Codes in Los Angeles California. Foreclosures and Zip Codes do Matter.”
How can the prices of homes in expensive areas have gone up if so few homes in those areas are selling? Wouldn’t the prices just remain the same? How can a price go up on one’s home if they haven’t sold it?
Real Estate prices will go back to the 1940’s level….
The collapse/crash is set for: 9/08
Buy silver and gold…take delivery….and store it yourself….
They wrote a Book how they would rip you off….if you had read this Book… you would know how to protect your assets….
ARYA MENSA Consultants
P. O. Box 11264
Fresno, CA 93772-1264
SEMPER FI.
Dr. H…are you supporting the theory that there ARE high end areas that will be immune to the bubble–albeit very small ones–or do you feel that the reaction in merely delayed there? Is there any evidence to suggest the top 8 zips and areas like the south beach cities are going to implode too?
There’s only one person who can stop the feds & FDIC’s wizardry, unfortunitly he was created by J KRalling.
We are royally screwed.
the reason for the increases in the four top zips:
the 10 million dollar houses are still selling, but not the 2 million ones
so median increases only in areas where there are 10 million dollar houses
I was tuned to cnbc when the case-shiller data came out and they started spinning away. It was breathtaking. They brought on at least 4 different people to tell us how we’ve now reached bottom since prices didn’t decline as rapidly as expected. Amazing. I can’t wait till we get a month where prices drop faster than expected. Then I’m sure they’ll tell us that such a rapid drop is a sure sign of a bottom. The spin has reallly helped keep the delusional rally going in the stock market though. Quick, buy, buy, buy; after all prices aren’t falling as fast as expected (which seems a dubious claim itself given DHB’s data), and you might miss your opportunity.
Dr.HB,
If a person falls off a 100 story building they will pass the 73rd floor before they pass the 50th floor. I know that’s what you really meant to say.
Leave a Reply