The Triple California Housing Threat: Low, Mid, and Upper Range Housing Distress Ladder. How the Housing Implosion will Spread to Higher Priced Neighborhoods.
The housing market in California is splintering into various broken segments. In one area, you have lower priced beaten down homes flying off the market like pancakes. Yet in these areas, you have to wonder what will happen once the major discounts and inventory run out? Next, you have mid-priced areas that are selling in low numbers but at relatively stable prices. This is the next market to tank because of the large amount of Alt-A and Pay Option ARMs hovering in those markets. These areas had a stronger buffer because of the structure of the mortgages but make no mistake, they will be coming down. And finally, you have the higher priced regions stalling out.
What we have here is the systematic dismantling of a decade long housing bubble. It would be great if we could predict with pinpoint precision how each market would unravel or when the bottom will be reached but when bubbles burst, they usually are messy. From some of the analysis I have put together for California, we will not be seeing any sign of a bottom until 2011. I have been making this argument for nearly a year and now we’re now seeing the story picked up by others:
“(The Press Democrat) Over the next three years, about two-thirds of the Alt-A borrowers in Sonoma County will see their payments jump sharply, according to First American CoreLogic. The trend will peak in the summer of 2011, the research firm projects.”
The next major story that is largely being underreported is that of the Alt-A mortgage market. Why this applies so directly to California is that over 50 percent of the $469 billion in toxic Alt-A mortgages are here in the state. The major problem of course is many of these Alt-A products are Pay Option ARMs that allowed borrowers to make minimum payments that negatively amortized and many now find themselves with higher balances in a state that has seen the median price fall by 50 percent in one year.
We’ve been hearing how the market is split up into many fragments yet how does this really look in practice? Today I want to give you three homes currently on the market in three very different cities here in Los Angeles County. The purpose is to put an actual face on the three markets currently dominating California real estate. We will look at the low, mid, and upper priced housing markets all within a thirty-mile radius.
Lower Priced Range – Compton
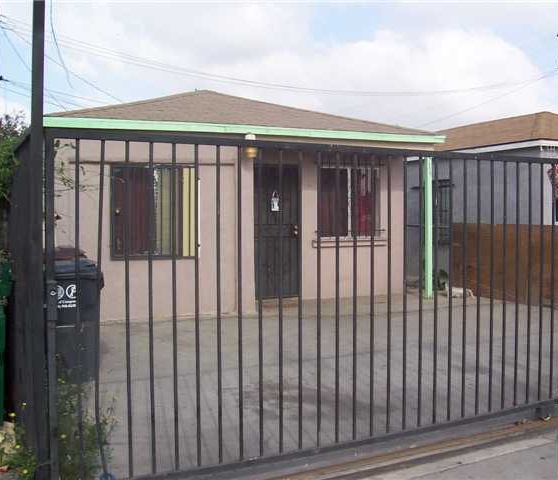
Compton California has witnessed each side of the housing bubble. During the boom, some homes in Compton were selling for $450,000 with only three bedrooms. Those days are now long gone. Our example home above comes from a zip code that has a median price of $137,000. This median price is a stunning 60 percent drop from only a year ago. Yet Compton is actually seeing homes sell. For all three zip codes in the city of Compton we saw 84 homes sell in the month of April.
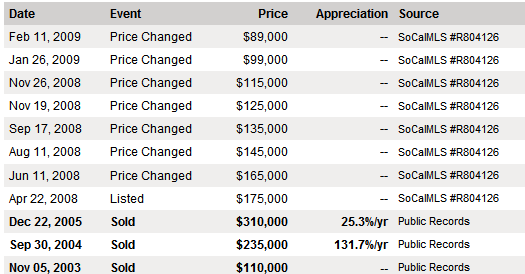
The above home is 828 square feet and has 3 bedrooms and 1 bath. This home has been on the market for 404 days. Its pricing history offers us a glimpse into the subprime bubble boom and bust:
At the peak, this home sold for $310,000 so the current list price is 71 percent below the top market price. The current psychology of the market is such that people are saying, “what in the world were people thinking?” Yet that psychological thought normally stops in the lower price range. The same economic fundamentals apply to the mid-priced and upper-priced ranges yet people still have not come to terms with this reality for the higher priced areas. The Alt-A implosion will make this abundantly clear at the end of 2009 and into 2010.
So why are homes selling in areas like Compton? Because the price is starting to make sense for some. Take this home for example. Say you were an investor. For an investment property loan, all you need is 25 percent down. Let us run the numbers:
Sale Price:Â Â Â Â Â Â Â Â Â Â Â Â Â Â Â Â Â Â $89,000
Down payment:Â Â Â Â Â Â Â Â Â $22,500
Mortgage:Â Â Â Â Â Â Â Â Â Â Â Â Â Â Â Â Â Â Â $66,500
PITI:Â Â Â Â Â Â Â Â Â Â Â Â Â Â Â Â Â Â Â Â Â Â Â Â Â Â Â $490 (assuming 30 year fixed at 6 percent)
The going rents in this area are roughly $700 to $800 for a place like this. This would make total sense for investors right? Well that depends. First, you need to realize that unemployment in the state is at a record 11 percent and growing. Some areas are taking the brunt of the economic storm much deeper. Compton has a median household income of $30,000 so a family would actually be okay buying this place. Some counties in California are seeing unemployment rates rivaling those of the Great Depression:
CA Counties:Â Unemployment Rate
Imperial:Â Â Â Â Â Â Â Â Â 26.9%
Sierra:Â Â Â Â Â Â Â Â Â Â Â Â Â 17.9%
Stanislaus:Â Â Â Â Â Â 16.8%
Sutter:Â Â Â Â Â Â Â Â Â Â Â Â 18.5%
San Joaquin:Â Â Â 15.6%
Colusa:Â Â Â Â Â Â Â Â Â Â Â 19.1%
Plus, not many people have $22,500 laying around. Many investors do and as we know, many current buyers at the lower end are investors. This place lists that it needs some “TLC” so it is hard to say how much additional capital is needed to get it rent ready. Either way, this is a perfect example of what is moving at a brisk pace in this current market.
Mid-Priced Range – Mar Vista
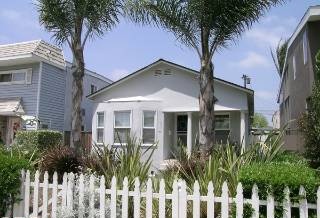
Our next home takes us to the Mar Vista community in L.A. Many people in the Westside, especially professionals look at Mar Vista as a starter home location. Yet the starter home was largely out of reach for many professionals. This is where the Alt-A mortgage products stepped in to fill the gap. A $2,000 mortgage payment sure sounds a lot better than a $4,000 mortgage. Plus, by the time you need to sell in 2 or 3 years, the home would be worth so much more that you wouldn’t need to worry about those nasty toxic mortgage recast payment shocks. That is, until the appreciation party stopped.
This above home is something that we will be seeing a lot of in the next 6 to 18 months. The above home is a 958 square foot home with 3 bedrooms and 1.75 baths. The location is the Palms, Mar Vista community of L.A. This home has been on the market for 16 days and we have already seen one price reduction from $625,000. The current asking price is $599,000.
Now I pulled up tax data for the current area and the median household income is approximately $82,000. So let us run the numbers for someone looking to buy this home today:
Sale Price:Â Â Â Â Â Â Â Â Â Â Â Â Â Â Â Â Â Â $599,000
Down payment:Â Â Â Â Â Â Â Â Â $119,800
Mortgage:Â Â Â Â Â Â Â Â Â Â Â Â Â Â Â Â Â Â Â $479,200
PITI:Â Â Â Â Â Â Â Â Â Â Â Â Â Â Â Â Â Â Â Â Â Â Â Â Â Â Â $3,269 (30 year at 5.25%)
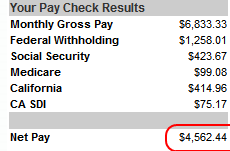
So what is the take home for a household income for someone making $82,000?
As a rule of thumb, you shouldn’t spend more than one-third of your gross monthly pay on your total home payment. So if your gross household income is $82,000, your top monthly payment should be at $2,277. That is why this rule works with the Compton home above. The take home gross of $30,000 per month is $2,500 so they can take on an $833 monthly payment. In some ways, the numbers are starting to workout at the lower end but are completely out of whack in the mid to upper range. Because of the Alt-A mortgages in these areas, many sellers are hoping to snag another buyer so they can exit. Yet as you can see from running the numbers, it simply does not make sense. In fact, you can work yourself backwards from the actual PITI to see what income would need to support this home:
PITI:Â Â $3,269 x 3 = $9,807 or $117,684 / annually
This is where the major disconnect occurs. Ironically, the subprime product actually had a usage in the market. It was designed for those with a poor credit history to buy a home with a much higher rate. Now I disagree with subprime loans merely because they were pumped out by unscrupulous lenders but they had a much cleaner design than toxic junk superhero Alt-A mortgage products. The Alt-A mortgage was purely a mortgage designed to operate in a bubble. It was crafted for continuously booming home appreciation. It was never meant to be a long-term mortgage. It had a life expectancy of 3 to 5 years for the most part (aside from Wachovia’s horrendous 10-year Pick-A-Pay craptasic loans).
The bottom line is the mid-range market cannot move at a brisk pace without these toxic mortgages reemerging. The reason sales are falling in these areas is because no fool is willing to pay the higher price. Sure, you’ll have your handful of sales each month but this will largely be gone in the upcoming months with the tsunami of notice of defaults that hit us in Q1 of 2009. This assures us more inventory for the next year. While the lower end is flushing out inventory with sales, the mid to upper range sells a handful of homes while a pipeline is simply building up.
For example, in our area above 13 homes sold in April and prices are off by 28 percent on a year over year basis. As you can see from our basic math, some sellers are pricing home at bubble level prices. Until prices fall back in line with local family incomes, this housing downturn will continue to unfold in California.
Upper Priced Range – Santa Monica
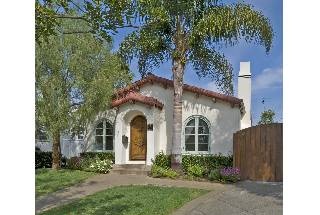
Our final stop takes us to a prime location in the Westside, Santa Monica. Now you need to realize that these areas will always have more buyers than sellers simply because they are in niche locations in very desirable areas of L.A. County. But that doesn’t mean prices won’t fall. Before I discuss the home above, let us look at the pricing action:
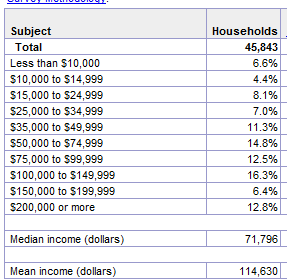
Now as you can tell from the above, even in Santa Monica sellers are having to drop their asking price. This 4 bedroom and 3 baths home is selling for $1,395,000. It is 1,923 square feet in a desirable area. Now Santa Monica has very unique income statistics:
Now let us first run the numbers on this home to see what income is needed to support this house payment:
Sale Price:Â Â Â Â Â Â Â Â Â Â Â Â Â Â Â Â Â $1,395,000
Down payment:Â Â Â Â Â Â Â Â Â $279,000
Mortgage:Â Â Â Â Â Â Â Â Â Â Â Â Â Â Â Â Â Â Â $1,111,600
PITI:Â Â Â Â Â Â Â Â Â Â Â Â Â Â Â Â Â Â Â Â Â Â Â Â Â Â Â $8,001 (30 year fixed jumbo 6.25% and 20% down payment)
Now using our 3 times rule we get:
$8,001 x 3 = $24,003 or $288,046 / annually
Take a look at the income stats above. Of the 45,843 households that currently live in Santa Monica, only 12.8% make over $200,000. With this home, we need an annual household income of nearly $300,000. Here again you see the major discrepancy of the current California market.
Investors buy homes for a few reasons. You buy for what many call “CAT” – cash flow, appreciation, and taxes. In many other states, investors like myself buy for cash flow where you can buy a home and get it rented and the tenant will cover your mortgage payment and expenses. This is something unseen in California for over a decade. We are now seeing a few homes like in Compton and the Inland Empire that are cash flowing. Yet many of these out of state properties will never appreciate like homes in California. The final reason is for the tax benefit.
Now you need to remember for this entire decade 90+ percent of California investors bought for appreciation. No one really cared about the cash flow and the tax benefits never came into the equation because many were selling properties off in a short period. Now what happens when you have the opposite of appreciation and prices still remain stubbornly high? You get our current market. Yet the lower end was like this in early 2008 and look at where it is now. The mid range will show significant signs of weakness later this year and finally, you will see drops at the upper range. With our state budget in a mess and more cuts coming, there is no reason to believe the “A” from appreciation will be coming back anytime soon.
 Did You Enjoy The Post? Subscribe to Dr. Housing Bubble’s Blog to get updated housing commentary, analysis, and information.


 Subscribe to feed




20 Responses to “The Triple California Housing Threat: Low, Mid, and Upper Range Housing Distress Ladder. How the Housing Implosion will Spread to Higher Priced Neighborhoods.”
Watchout below Westside…. The denial stage has officially ended. The perfect storm is coming ashore this summer and sellers will be running for the exits.
http://www.westsideremeltdown.blogspot.com
Where is that Santa Monica income table from?
Dr.
I think you suggesting that 6.25% for Jumbo is Extremely conservative.
I have not seen a jumbo over 600K priced at less than 8% for the last 2 years, and 8.5% at the present time. That changes the equation dramatically, as you’re looking at PITI at well over 10K per month.
High end and medium-end properties are way out of whack. That said, I would hardly call that a high-end property, as it’s still way under 2M. Down south, in OC, high end properties start at 1.8-2.0M and up. We have years of supply of the stuff.
Chuck Ponzi
http://www.socalbubble.com
Don’t worry people the Terminator and the new Messiah will save you with inflation. Marc Faber has said that he is 100% certain America will experience hyperinflation, Zimbabwe style. Your mortgages will be paid off with inflated dollars, if you can hang in there long enough.
http://www.totalinvestor.com
Love it!
Yes, the “appreciation party” may have stopped. So let the new “PITI party” begin!
Longtime reader, first time poster.
I’m a Santa Monica resident, renter, wanting to get into a nice house to raise my kid. I make $263k annually and the examples above make me finally understand why I can’t buy a decent home here. Thanks again, Dr.HousingBubble, for helping me see what’s happening. Your blog is one of the few places where I can get this kind of insight.
I’ll pay 250,000 for that house in Santa MOnica. :o) C’mon deflation!
Shhhh, Faber!
Replay to comment by Tony Smith: I just don’t see private and public employers increasing wages by double digits in order to keep up with inflation prediction. Employers can hardly borrow today due to banks not willing to lend without collateral and backup. The printing of dollars by the Feds is still much less than the asset wealth destruction that has occured world
Public employers will still knuckle under to the unions, and give raises. The San Luis school district pays 40% of their teachers $84,000. a year,for 180 days work.
The union wanted a 10% raise, at a time when most private employers are cutting salaries. Do you think the school board cut salaries? Nope. The school board caved, and gave them a raise, (although not as big as the union wanted.)
Comment by Steve
Where is that Santa Monica income table from?
>>>
That is the US Census data. Go here. http://factfinder.census.gov/home/saff/main.html?_lang=en
>>>
You can look up an area by name (and if the county name is the same as the city, it will ask which you want) or zip code.
Comment by Robert Cramer
Public employers will still knuckle under to the unions, and give raises. The San Luis school district pays 40% of their teachers $84,000. a year,for 180 days work.
—-
Hmmm… not that much for having a Master’s degree. And BTW,
>
(1) teacher’s are paid over 12 months and have to do Continung Education classes out of their own pocket and generally their work days go for 9-11 hours with prep for the next day.
>
(2) Last I heard 180 days is less than 6 months. School years normally start (for the staff who have to do the preparation for the start of school) in early-mid August and go through the end of June. Exaggerating does not make any point except that the writer is irrational on a subject.
>
(3) Can someone making even $84K afford to BUY a house where they teach?
Cant wait for the floor to drop out of this thing. We bought a small home with a silly thing called a 30 year mortgage 8 years ago. Since then our incomes have increased, out kids are bigger, and we have been wanting to buy a bigger house. I resisted the siren call of easy no doc loans just to get into a house we couldnt afford. I always compared the cost to my actual budget, not what some slickster told me I could afford. I look forward to picking up the scraps of those who overindulged.
http://data.bls.gov/cgi-bin/cpicalc.pl
Using the CPI Inflation Calculator above, $235,000 in 1996 dollars for the “Upper Priced Range – Santa Monica” home translates to only $319,384.32 in 2009 dollars. Even if the additional inflation adjustment amount were doubled, the “adjusted” home price would still fall just under $404K! What could possibly account for folks ever believing this home is now worth just under $1.4 M? Does all financial common sense and reason leave all those who “cross the border” into California — or are “California dollars” majically worth more than those used in the rest of the U.S.? The price per square foot is $725.42. That home could be torn down and replaced with a new structure for probably no more than $300/ft2 I would think — even in “expensive” California. (In many parts of the country, the new replacement structure cost would fall at or under $150/ft2 — sometimes well under. How large is “the lot” the home sits on, and what is it’s valuation; — as well as the ratio between the cost of the lot and the price of the structure (home) that currently exists on it? It’s not as if anything has actually radically changed over the past 13 years — has it?
This is the scariest video you will ever watch! Truly shocking!
http://www.youtube.com/watch?v=cJqM2tFOxLQ&eurl=http%3A%2F%2Fdailybail.com%2Fhome%2Fthere-are-no-words-to-describe-the-following-part-ii.html&feature=player_embedded
Please do not share with your children or the Chinese bagholders in this train wreck.
Be brave Comrades!
Blutown –
There are no words………..
Thanks AnnS, I feel sorry and sympathetic for all the teachers now….while I’m at it, the friefighters and policemen too…all in that top 10% of wage earners in the USA!!!
Hi:
Two weeks ago, I walked into an openhouse for a small two bedroom condo in Palms with a listing price of $500,000. The realtor said, “You better act quick, it’s a foreclosure and the best deal on the westside!” Then another couple came in and looked all exicted about the place. At the time, I thought, maybe they are hired actors.
Well, the place is still for sale. They had another open house this past weekend.
I guess not everyone on the westside thinks $500,000 for a tiny condo, is a great deal.
@blutown
…Damn…you know, one time I left 9 trillion dollars in my pants pocket and I just forgot all about it. You know, it happens. They should just quit picking on the Fed. They all seem like real nice folks…gotta go, I got some green shoots cooking on the stove…
Comment by surfaddict
June 2nd, 2009 at 5:28 pm
Thanks AnnS, I feel sorry and sympathetic for all the teachers now….while I’m at it, the friefighters and policemen too…all in that top 10% of wage earners in the USA!!!
>>
In what world are police officers in the “top 10% of wage earners”? Ditto teachers, firefighters etc. I notice that you DO NOT include any statisitcal sources backing up your exaggerations. (Note: Libertarian right-wing columnists spouting off are NOT sources.)
>>
Our EMTs make around$15 -20 an hour. Teachers in this county makearound $35,000 -75,000 (PhD, very senior & experienced, administration etc). The deputies make around $30,000 a year.
>>
Hardly the $200,000 a year for a high school grad working on Wall St. http://finance.yahoo.com/career-work/article/107145/From-Ordering-Steak-and-Lobster-to-Serving-It Or the $100,000+ a year for a “financial advisor” aka Mish of Mish’s Gobal Econ blog. Or the $225,000 a year for a realtor in the bubble. Or the $90,000 a year for an RN (and that is only a BA and they are not at routinely at risk of getting shot or having a burning building collapse on them.) Or the $290,000 a year for a wholesale foods marketing rep. And the list contiinues…..
The previous post makes the false assumption that 100% of people renting can or want to buy. This is just not true. Why would any investor buy a property with 35% down if they were not able to collect rent that covered at least 80% of their initial investment? When it is cheaper to rent vs. buying, that is a very clear signal that we are nearing the bottom. When you see investors snatching up properties with cash, now is the time to buy.
Leave a Reply