
Short Sale Report Volume 4: 16,646 Short Sales in Southern California.
I prefer to take economic data and information like I take my sushi, raw with wasabi. In October, we reported the monumental tipping point of going over 10,000 short sales in Southern California. Those days now seem like a distant reality since as of today, there are 16,646 short sales in the Southern California housing market. There are a few graphs that we will be looking at in greater detail since these show the battle occurring in the housing trenches. Short sales are an important bellwether of the health in housing and until there is a slow-down in this area, we can put to rest any notion that we are approaching any bottom. Also, there is this sudden notion that somehow we have been in the housing “slump” for ages and need to do every sort of bailout to keep housing prices sky high. Forget that housing has been on a tear for 10 years. It is as if there was no massive bubble and that only talking about the problem is somehow going to make it worse. In a way, it may shift the market psychology but you can’t make income appear out of thin air like David Copperfield. There lies the caveat. All this talk from politicians fails to address the fact that our economy was founded on conspicuous consumption and housing being in a bubble. Not something that bodes well for income when the punch is taken away.
*Click for closer look at bailout success
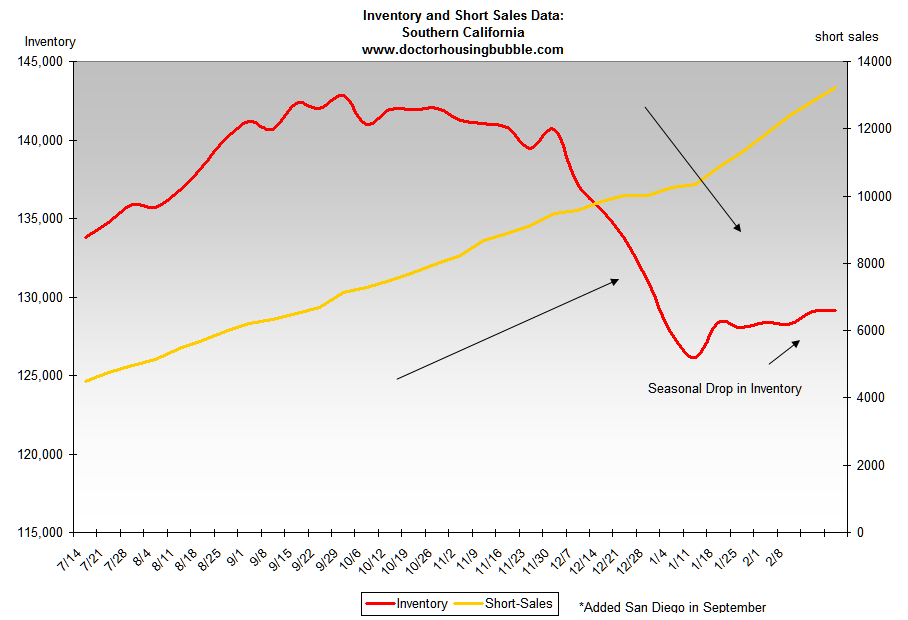
The first graph shows inventory and short sales. As you can see, we are now out of the seasonal winter drop and inventory has been steadily increasing. Typically the boom in inventory numbers hits in spring and summer. Currently in Southern California we have 149,946 homes on the market. The chart above excludes San Diego inventory numbers since I do not have data beyond September but the short sale number does include San Diego numbers. According to DataQuick 9,983 homes sold in January. So let us do a bit of back of the napkin math:
Total SoCal Inventory (149,946) / Total Current SoCal Monthly Sales (9,983) = 15 Months
That’s right folks, we have over a year of inventory at the current sales rate and take a look at the short sale inventory. This thing is increasing at an exponential speed. There have been many studies discussing balanced sales figures but suffice it to say that 6 months of inventory is typically a balanced market for housing. We are nowhere close to that. Now let us take a look at another chart:
*click to see the steps of decline
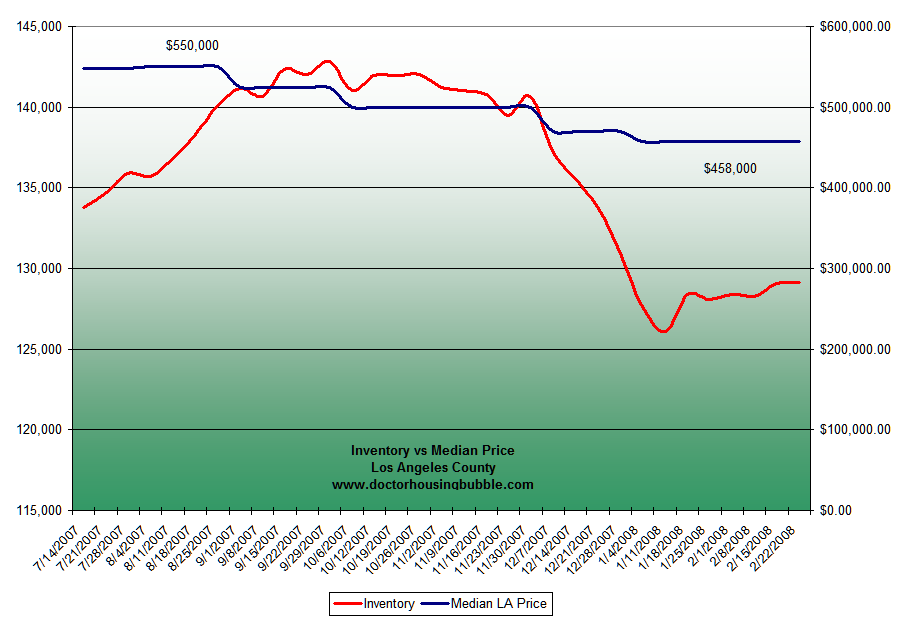
This chart shows that from the peak of $550,000, Los Angeles County is now off its median peak by nearly $100,000. The importance of this chart is that it is an excellent predictor of where things will be heading. As you can see, inventory is increasing. Until inventory starts decreasing or sales start going through the roof, prices will not be going up. Aside from the credit crunch can it be that inventory is growing also because of reluctant sellers not realizing the reality of the current market? Are they swimming in a Freudian dream of housing delusion? Do they not realize that California is in a $16 billion short fall and we are now using cockamamie ideas of balancing the budget such as closing schools (good for our future), firing teachers (higher unemployment), and letting out inmates (more home buyers!). The list of Real Homes of Genius only keeps expanding and the tide is now receding and we are going to be in housing purgatory for a very long time.
The stories only get weirder and more complex as in any bubble. Greed makes people do absurd things. I recall reading a story about a farmer selling his entire livestock for a handful of tulip bulbs during that historical bubble only to realize that the one cow he kept snuck into his home at night and ate the entire tulip stock. In this insane market we have to come to terms not only with high housing prices and defunct mortgage products, but we also have to admit that a majority of the population became speculators with the single biggest asset class in America whether they acknowledge it or not. This is a problem. First it was only a subprime thing. Then it was a subprime and credit market thing. Now it is a national emergency and every homeowner needs to be bailed out with Hope Now, Project Lifeline, Free Money Express, Wal-Mart Vouchers, 7-11 Ice Cream Relief, Mortgage Moratoriums, and every other Orwellian type of concoction you can think of. I won’t be surprised if some of these things fly since Americans are so addicted to credit they will fight tooth and nail once they realize they are maxed out.
 Did You Enjoy The Post? Subscribe to Dr. Housing Bubble’s Blog to get updated housing commentary, analysis, and information
 Subscribe to feed


5 Responses to “Short Sale Report Volume 4: 16,646 Short Sales in Southern California.”
I am sorry but we have been bailing as a nation since 2000.
1) Lowest tax rate in decades.
2) Lowest interest rates in history.
3) Lowest capital gains taxes in history.
4) Huge deficit spending by the government.
For all of this stimulus and this is enough to make the dead walk what have we gotton for our money.
A) 3 million less manufacturing jobs.
B) A housing bubble to give the illusion of wealth.
C) Record amounts of debt at all levels of society personel,federal,state,city county,and corporate.
D)At max 4.7% GDP in one or two which is below the level of real inflation.
Hell we have been in a depression for a while. As my grandfather always told me we were broke in the 1920s we just didn’t know it yet.
Low taxes does not necessarily mean we have been in a depression. I am not defending the loss of the manufacturing jobs, the bubble was an incident created by the federal reserve policy and also for foreign investors looking for a stable place for there money after other nightmares in other countries. Deficit spending is in part due to the expensive nature of war and also the added bureaucracy we have been adding. Record levels of debt, on a historical trend the level have debt appears to generally have gone up, it just super went up in the last few years.
Depression could come but I dont think we have been in one. I am not trying to dismiss your opinion but I do think that your position is incorrect.
And to think we are only in the very beginning phases…
The ball of yarn is unraveling … and picking up speed.
Wow, the doctor sure is negative! Your recent tirade made me laugh tho, good job. A lot of times youre just rehashing and it becomes a bit generic for us bear types, keep up with the historic comparisons it gives your perspective more flavor. I like it.
Am I missing something here? The charts I’m looking at don’t show an inventory level of 149,000 at any time and the most recent reading is maybe about 128,000. Ditto the trend. There’s a much greater drop-off for the holiday season than I’d thought we’d seen and not that much of a recovery of inventory. The highest short sale number I see is less than 14,000. I’m not disputing the fact that the housing market is crashing; I just don’t see your figures on these charts. Do I need new glasses?
Leave a Reply