I’ve been tracking the Southern California market for over a year. The inventory numbers for San Diego, Ventura, Orange, Los Angeles, San Bernardino, and Riverside Counties hit a peak in late September at 166,514. During this same time, sales for the region have steadily decreased. At a certain point, it was common to see monthly sales for the Southern California region hitting 30,000+. When we look at the current inventory number and the sharp decrease, the current inventory number for the region stands at 147,404 it looks like sales have increased; in other words since October 19,110 homes have been taken off the market either from sales or being removed from the MLS listing service. The new spin at least from some perma-housing bulls is that this decrease in inventory is a strong indicator that there are fewer homes on the market and thus, by the magic of supply and demand less homes creates higher prices and once in a lifetime buying opportunities. Let us take a longer view of homes sales data from the Southern California region:
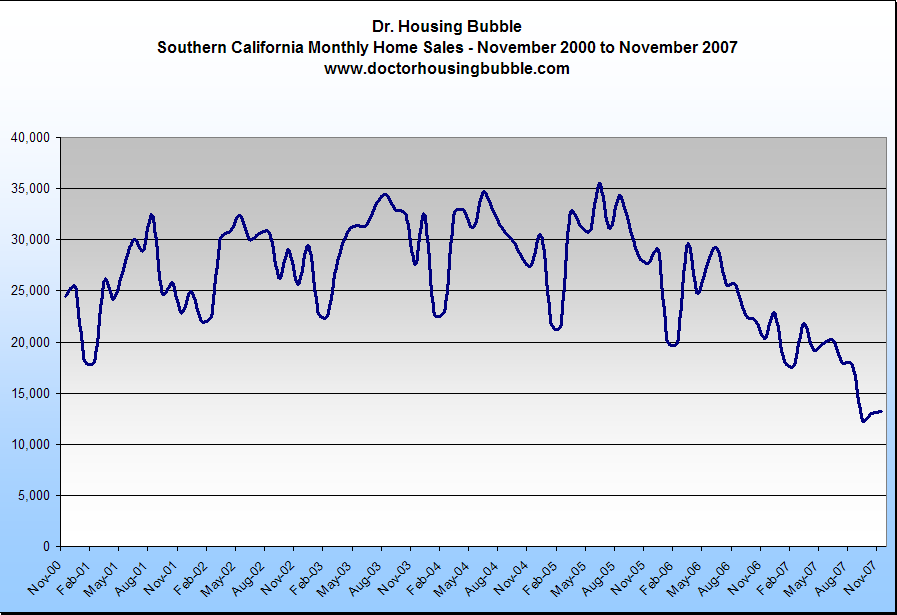
*Source: DataQuick
It is rather apparent that home sales have fallen off a cliff. In fact, since August of 2006 the overall trend has been downward with home sales. The next major thing you will notice is the credit crunch has pushed home sales even further toward the downside below the 15,000 mark which hasn’t occurred this decade. How did the credit crunch impact Southern California so quickly and painfully? A large number of homes in this immediate area were bought with exotic financing and without this major crutch, the market simply cannot go on and prices have to correct to reflect this new reality. So the argument that the major decrease in inventory is showing signs of a bottom is absolutely a ruse. In fact, looking at sales numbers we can conclude that many people simply pulled their homes off the market for the winter with the prospect of selling them this summer. If we look at the aggregate numbers on an annual basis, the story becomes much clearer:
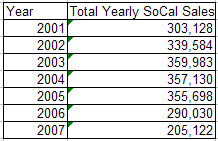
*Data for 2007 needs only December sales; approximation based on trend.
Now unless we get 100,000 sales in December, these numbers aren’t moving and we’ll update them later on in the month. We stayed at peak sales from 2002 to 2005 with very little variation. Even 2006 was not a bad year since it compares to the 2001 sales numbers. 2007 is an entirely different story and foreclosures and short sales are here to stay.
Short Sales Tell us a Different Story
Let us take a look at another reason why an overall inventory decrease is a bad predictor of a market bottom. The below chart shows the massive increase in short sales and this number, has steadily been increasing regardless of the season:
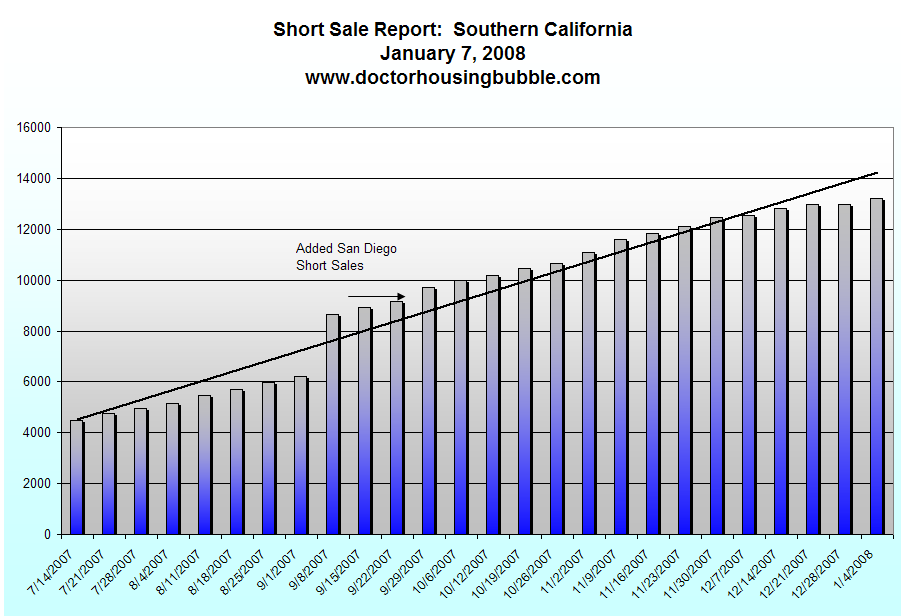
Short sales are continuing to go up for the region. A short sale occurs when a seller carries a higher mortgage balance than what the home could sell for in the current market. Essentially, they are underwater. During the initial part of 2007 many lenders were reluctant to approve any short sales but given the expensive nature of foreclosures and the darkening clouds hovering over the housing market, they have been more willing to work with sellers in trouble. At last count, there were 13,000+ short sales in the region. In some counties such as San Diego, short sales make up approximately 15 percent of all inventory on the market. These are signs of major market distress and clearly show that we have a far way from hitting the bottom of the market. Short sales, unlike sellers who choose to sell, do not have the option to pull a home off the market. These sellers need to sell and get out quick. They do not have the luxury to speculate and wait until summer thinking we will be back to business as usual. These people are having cash flow problems and cash flow problems are the main reason for foreclosure. What does this mean? People are drowning in debt and since they’ve maxed out their credit in every regard, the market simply cannot support any more debt.
It’s the Income Stupid
Another interesting argument coming from the bull camp is that after taxes, housing payments are relatively cheap. There is no disputing the fact that housing is a good investment at the right price and that there does exist tax benefits to owning a home. You can write off your interest payments for example and all is well in the land of housing. Yet if the equation was so simple, why are sales and prices hitting massive declines? If the formula was so simple, housing would still be booming. The problem with this analysis is the assumption that the after tax benefits of the home improve a person’s immediate cash flow problems. When you send a payment to Bank of America, Countrywide, Wells Fargo, Washington Mutual, or whoever owns your mortgage you know that you need to make the full payment including principal, interest, insurance, and taxes. We are assuming that like most folks, you have your interest and insurance in impound accounts. If you don’t you still have to make these payments just on a semi-annual basis. We also realize that many people went with option ARM mortgages, which in fact I believe is such an enormous problem that we cannot even fathom or begin to tackle this 800 pound Animal Planet gorilla since we are dealing with another major issue with the current subprime debacle. With some of these option loans, people have the ability to pay only interest and many times, not even that in effect going negative amortization. One major catastrophe at a time. Back, to the current tax debate. The problem isn’t the tax benefits and no one will dispute this. The issue is that your entire payment is due on a monthly schedule. That is, you pay from your current net income your monthly housing payment.
The tax benefits come after the fact. If your combined housing payment is $4,000 and you only have $3,500 coming in, you have cash flow problems. Rates resetting are causing cash flow problems. People losing jobs are causing cash flow problems. Hypothetical scenarios only work when reality coincides with the actual problems on the street. This is what is happening. In addition, the assumption is people have a high enough income for the tax right off. For example, say you took out a $475,000 mortgage on a $500,000 home at a rate of 6.5 percent. Each monthly payment is composed of approximately $2,500 in interest during your first few years. That is, you are paying $30,000 in interest per year and you will need a high enough tax liability to right this off. Let us assume you are single and making $80,000 per year. Your yearly tax and state liability in California with no 401(k) contributions and your standardized exemptions will run you about $20,000 per year. So you are not maximizing your full $30,000 interest payment since you don’t even have a high enough liability! Income is everything amigos and paradoxically, we had no income verification loans. Chew on that for awhile.
That is besides the point. If you can’t afford your payment with your monthly cash flow, all this other semantic exercise is pointless. You are functionally insolvent and your only option is to either sell in a tanking market or allow nature to take its course through foreclosure. But households in Compton, Lynwood, Downey, Lakewood, and other lower to middle income areas are making $150,000 per year right? The median prices in a few of these areas hit $500,000+ during the bubble times (some are still in this price range). It is incredibly irresponsible to think that incomes do not matter. In fact, I’m not sure how many of you caught the ABC/Facebook debate this past weekend but something very striking was let out of the bag by the moderator, Charlie Gibson. During the Democratic debate, he was talking about the fact that some candidates may raise taxes on higher income families. He threw out a hypothetical scenario in a very serious tone and said, “but what about a family of 2 professors, making $200,000 a year…†He would have gone on if it wasn’t such an absurd question and the audience hadn’t busted in laughing. He wanted to take back his statement but it was already out. The assumption is the majority of Americans make this much when if fact, it is a very small percentage of the population. The mainstream media is in the same bubble that Wall Street and Washington D.C. are in. They assume since their immediate circle of friends and confidants are making $250,000+ a year, they assume the vast majority of Americans are doing so. They are not. If anything it simply shows their elitist attitude and if the results in Iowa are any indication, people are simply frustrated with the status quo and the inability for these lifelong politicians and commentators to relate to the man and woman on the street. See, for these folks they do need the tax right off – there is an interesting piece at CNN called Millionaire in Chief. Suffice it to say that all leading candidates are financially okay and aren’t worrying about their interest payments. If you noticed as well, suddenly for both Democrats and Republicans the economy is the number one issue. If you lose your job, talking about tax benefits is like talking about a rocket trip to Uranus. The economy is always a number one issue when it is declining and the party in charge usually pays. Think of Hoover during the Great Depression being replaced by FDR and Carter during the inflationary and high unemployment period of 1977-1981 replaced by Reagan. Keep in mind that history and politics are fickle about being at the right place at the right time. Both Hoover and Carter at times aren’t regarded that highly but FDR and Reagan are seen as models of both the Democrat and Republican parties usually having their name resurrected on a continual basis.
So let us break down the actual income numbers for the country. It always helps to see where the chips are on the table:
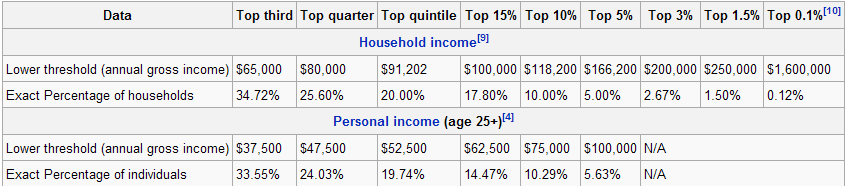
*Source: Wikipedia and Census.gov
For household income, if you make $91,202 or more you are in the top 20 percent of households. If you make $118,200 or more, you are in the top 10 percent of households. If you make, $200,000 or more like Charlie Gibson was referring to in New Hampshire, you are in the top 2.67 percent of all households. No wonder why the audience reacted the way they did with this hypothetical scenario. What would have been more realistic is a scenario of a household where the income was $80,000 to $100,000 per year. At least in this sense, you would be talking to 25 percent of the U.S. population. We did an article showing the massive impact debt is having on current households and how debt is an invisible hand that forces many families into massive debt without any choice. By listening to Wall Street and some of these pundits you would think that we are living in some sort of plutocracy. And in many ways, we are with the pressure being saddled on an ever disappearing middle class. If you look at the massive amount of power lobbyists have including the housing industry on Washington, you start having a better picture of who Uncle Sam is looking out for. Heck, the current U.S. Secretary of the Treasury Henry Paulson was CEO of Goldman Sachs, and remarkably GS is one of the few places that held on during the credit crunch decline because of strategic investments. What a coincidence.
The fact of the matter is we are starting to see a battle of the classes. The delusion many of those who bought houses, leased cars, and went into massive consumer debt is that they in fact were part of the middle class. The reality is that the disconnect is getting wider each day and these exotic mortgage products were only the next logical extension of a society that is mortgaging their future away for instant gratification that cannot be met via income. You can view the massive growth of debt as a symptom of stagnant wage increases over the decade. The increasing unemployment numbers are much worse than what they appear on the surface. Mish over at Global Economic Trend Analysis does a great job discussing the 5 percent unemployment numbers of last week. Suffice it to say that we are losing higher paying jobs and folks are simply dropping out of the workforce. Major losses in construction and manufacturing were off set by government and service jobs (aka many people working at the mall during the holiday season yet numbers still look abysmal). It’ll be interesting to see once these seasonal worker numbers are factored into the updated numbers for the next few months.
So what’s the bottom line? There is no bottom line to the housing market. At least not in California. I’ve noticed that the argument now is focusing on the aggregate numbers for the nation since many states stayed clear from this bubble. After all the argument goes, why focus on the metro areas that are getting hammered? Well because the bubble was fueled from these areas and for example, Washington Mutual and Countrywide have nearly 50 percent of their portfolio mortgage debt in these areas according to Goldman Sachs who again are amazingly one of the few folks on Wall Street surviving this mess. It wouldn’t be such a big deal aside from the fact that these are two of the largest mortgage businesses in the country. Also, California represents 25 percent of the mortgage market so yes, this is a big deal if we are having Real Homes of Genius imploding at an exponential rate. But why worry about incomes?
 Did You Enjoy The Post? Subscribe to Dr. Housing Bubble’s Blog to get updated housing commentary, analysis, and information
Did You Enjoy The Post? Subscribe to Dr. Housing Bubble’s Blog to get updated housing commentary, analysis, and information

 Subscribe to feed


22 Responses to “Massive Inventory Decrease in Southern California. Is This the Fabled Bottom?”
Excellent post as usual, but just one quibble, and that is I thought the phrase was “write off” … not “right off”.
http://en.wikipedia.org/wiki/Write_off
Probably had the sound of the word in your head… I tend to do that.
I have found your articles to be consistently informative and very well written, and stop by frequently. Thanks for all your efforts.
In the long run, you have to live within your means and (real) housing prices in inflated areas will fall more than most people believe just because of that fact. Stephen Roach from Morgan Stanley has a very good analysis of why asset prices (housting included) must fall at http://www.ft.com/cms/s/0/5a5419aa-bd47-11dc-b7e6-0000779fd2ac.html
So, you mean not everyone household in California makes $200K+ a year???
They all sure live like it, or at least project that image to the rest of America. Since SoCal is often on TV, many people in the rest of America try to emulate their conspicuous consumption habits and we now have a pretty ugly attitude in this country that items like cars and purses are aspirations.
Good thing H2’s and BMW’s are almost impossible to counterfeit….
“The new spin at least from some perma-housing bulls is that this decrease in inventory is a strong indicator that there are fewer homes on the market and thus, by the magic of supply and demand less homes creates higher prices and once in a lifetime buying opportunities. ”
UH HUH…….and there is only one diamond in the world that is called the Hope Diamond. Being rare, it should have a LOT and LOT and LOT of potential buyers if ever put up for sale. Problem is that there are NOT a LOT of buyers who could afford it.
It is the INCOME, stupid!
Why oh why don’t these people get it that it doesn’t matter what the supply is if the there are not enough potential buyers who can afford the price?
CA median household income is in the mid-$40K. It is no different from the rest of the US in that respect. Less than 18% of the households can afford those median priced houses.
Thank you for such a well written article. I too noticed that moment with Charlie Gibson. It is true that “Washington” does not have a real understanding of what real incomes are.the GS Scale goes to 120k and many many people in the area are near the top.
I was wondering a couple of years ago, in the DC area, just who the heck was affording all of the million dollar homes that were going up. My friend, an attorney, said it “only” took an income of $250k to qualify for a mortgage that size. I looked at her with bug eyes and asked how much did she think the rest of us, who are not partners at law firms, make? Now we know it was a housing boom built on a foundation of cards.
I also think that TV has contributed to this phenomonon. I saw an article once where the author was trying to relate the housing shown on TV shows to real life incomes. For instance, in the wonderful Mary Tyler Moore show, Mary lived in an efficiency in Minn.that was an old house. Very believable for her salary and cost of living. Now compare to Desperate Housewives where even unemployed or underemployed housewives such as Susan, the poor children’s book author, or Edie, Realtor, own million dollar manisons decorated to the nines. No wonder people’s expectations of what they should be able to afford are out of whack.
It’s funny how almost all homes that are still in the 350,000 to 550,000 range say “great for a first time buyers and investors”. Why would a FTB or investor jump into a market that is in such chaotic state. Most of the middle class area homes which attract most FTB are losing value at an unprecedented rate. It just goes to show the desperation of real estate agents which will say and do anything right now to get a sell.
I’m not sure if this makes sense. You wrote:
“That is, you are paying $30,000 in interest per year and you will need a high enough tax liability to right this off. Let us assume you are single and making $80,000 per year. Your yearly tax and state liability in California with no 401(k) contributions and your standardized exemptions will run you about $20,000 per year. So you are not maximizing your full $30,000 interest payment since you don’t even have a high enough liability! Income is everything amigos and paradoxically, we had no income verification loans. Chew on that for awhile.”
So, $80k adjusted gross income. Standard deduction = 5350. One exemption = 3400. You can deduct the full $30k of interest and it will reduce your taxable income by $24650 ($30000 – 5350). Tax without itemizing interest deduction = $14243. Tax by taking interest deduction = $8080. Savings of $6163.
Your comment seemed to insinuate that you would get no benefit from the $30k of interest. Maybe I misread it but you do get some tax benefit.
Fantastic encapsulation of inventory diminishment.
Inventory is definitely being effected by the number of unsold houses that are being pulled from the market. A comparison of the change in inventory and the number of houses sold will show that.
I think part of the reduction in supply of homes is due to them turning into REO’s, which can take up to a year from filing to market by the bank. There is alot of dead inventory that just sits in limbo because nothing legally can be done with it yet.
I guess I’m pretty far up there in the top percentage wise in terms of income. Of course this being southern California, I still can’t afford anything (especially not housing!!).
I’m late.I have to go buy something I can’t afford ,with money I don’t have ,to impress people I don’t know.I’ll be right back.
@glenn: “So, $80k adjusted gross income. Standard deduction = 5350. One exemption = 3400. You can deduct the full $30k of interest and it will reduce your taxable income by $24650 ($30000 – 5350). Tax without itemizing interest deduction = $14243. Tax by taking interest deduction = $8080. Savings of $6163.
Your comment seemed to insinuate that you would get no benefit from the $30k of interest. Maybe I misread it but you do get some tax benefit.”
I should have been clearer on this point. You made the point in your example. Let us take your numbers. You are taking from your monthly cash flow $2,500 simply for interest to receive a $6,163 “rebate.” That is the problem that I hear many agents/brokers telling their clients. Well, if you simply took the $2,000 that you would save from renting or leasing and stuck it away in a savings account, you would have in cold hard cash, $24,000 after one year. Not only that, now you are battling with a depreciating market where your $500,000 home that you bought might be down 10 percent ($50,000) plus the $24,000 difference you would have in a savings account. So in one year, you are out $74,000 for a $6,163 rebate and your principal reduction is always pittance in the first few years. In fact, we are seeing 15 to 20 percent reductions which is leaving many people underwater.
Point being, you aren’t getting $30,000 “back” and this is how many people are bamboozled. It looks lucrative on the surface. In your analysis, the difference is only $6,183 when all is said in done. This is at the expense of being locked into an overpriced asset and locking away your monthly cash flow in something you may not be able to sell in a few years at the current price.
@All,
I’m glad people are finally acknowledging that income does in fact matter. The market was chewing on the data today, moving up and down slightly until it broke rank and gold shot up, housing stocks got hammered, and housing numbers were pathetic yet once again. I’m actually incredibly frustrated with the mainstream media because they are giving consumers the idea that we are somehow near the bottom. Each time we have a bad day they spin it as “was this it? Is this the bottom?” Or if there is a minor move up, “time to get in! this is it!” One need only look at the numbers and follow the trend. We are a long way from any bottom especially here in California. I’m curious to see the numbers for the 4th quarter for many of these companies that said they were going to be profitable.
The Mainstream is starting to get it..
Did you see the Simpson’s on Sunday night?
The chalkboard at the opening read:
“Teacher did not pay too much for her condo”
OMG!
“Consumption is a measure of Wealth.” Mike Norman
http://www.europac.net/Schiff-FBN-1-02-08_lg.asp
at 13:10
I thought that one “bottom” for prices was the cost of building a new house + land. Or these days, getting a prefab house + land + hookups. So a used house is like a new house – depreciation (aka, it’s always declining in value because things rot).
Typically you will see a reduction in the number of listings through the end of the calendar year as many listings expire. It then takes a positve action by the seller to either extend the listing or cancel. Many listings will be extended and agents will then have to take the additional positive action of updating the listing. With the holidays these 2 actions can take weeks to happen.
We will typically see a superficial drop around this time of year and then the number of listings will tend to build up into the spring as new “sellers” come to market. Until we see the month over month increase in sales the inventory will not truly begin to decrease. The market will first reach a balance of sales and new listings before it tips into “improving”.
On another note I found a pretty cool new site for buyers and sellers. http://www.beekast.com it is like the youtube of realestate. You can shoot video of your own home and post in on the site and it is free. I like how you get a real feel for the property as pictures sometimes lie…
Dr HB,
You talk a lot about the stock market. I was just curious if you shorted some of the homebuilder stocks and some bank stocks? It was/is a great opportunity to make some money on the downturn.
Percentage of families making 200K+ a year:
San Diego County: 6.8%
Ventura County: 8.3%
Orange County: 9.8%
Percentage of families making 100K+ year:
San Diego County: 31.4%
Ventura County: 37.3%
Orange County: 38.4%
Don’t underestimate how wealthy California is compared to the rest of the country.
Great article and the point about south cetral LA hitting prices of over 500K makes it clear that people don’t make the kind of money to afford what they thought their house is worth. To the comment by SD Scientist look to the comments by Steve and JS – even though California households have higher incomes it still is not enough to justify the peak market prices.
Too many people read too much “rich dad – poor dad” and watched too many real estate investment programs on flipping property. The guy making money in real estate has turned out to be the guy selling you the book. Every investment market has ups and downs. People need to remember that while you can make it money money in Bull Market and you can make money in bear market no one makes money when they make a pig of themselves in any market. Hopefully the government won’t step in or pull some RTC/HUD bailout so that the market can truely correct itself even at the expense of those who miscalculated their potential exposure.
“Yesterday, stocks shot up toward the end of the day for no apparent reason (PPT) which is becoming a more and more common occurrence…”
The Dow turned at 12505.91. This is very close to the intra-day low (not closing low, which was 12800) where the August market sell-off reversed hard. The intra-day low is where the sellers were truly flushed out of the market. It would have been anticipated by technical traders everywhere. The S&P cash turned around 1380, also close to its August intra-day low. The move looks purely technical, not PPT-engineered, to this market watcher.
I just heard the other day that a good chunk of homes currently on the market are not included in MLS listings because realtors, as if people can’t figure out that now is NOT the time to buy/flip.
Leave a Reply