
Housing Contradiction: Home Prices Down = Sales Up. Any Questions?
I’m about to reveal an extraordinary secret, one that rivals the coordinates for the lost city of Atlantis. As experts and government officials are now in their second year of scrambling for housing solutions it appears that we have found one that works. Here it goes; when you lower prices you actually move sales! Astounding! This is one of the most basic points you learn in economics: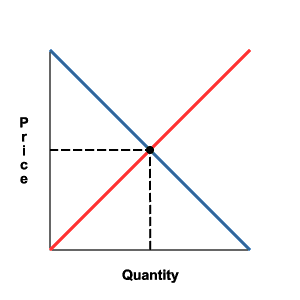
Take a look at the graph. Inventory is still very high so the supply curve even with current sales is holding steady simply because of the increase in distressed properties. This has maintained a very high amount of inventory on the market. Prices for a very long time held steady so demand did not move adding further fuel to the growing inventory numbers. Now, we are seeing major price reductions and sales are increasing. Well of course! The demand curve is now budging because the supply and demand of most any economic item is sensitive to price especially one with elastic demand. For example, if prices become too expensive to buy people will simply rent (i.e., Los Angeles). That is a perfect substitute. Items such as insulin have inelastic demand curves since prices can double and people would still pay that price simply because there are no good alternatives.
Today’s news perfectly illustrates the point that housing will move with price changes. Keep in mind these are headlines for the same day:
“(MarketWatch) Decline in home prices accelerates in March
Case Shiller index down 14.4% in March from year earlier
Home prices in 20 major U.S. metropolitan areas have dropped a record 14.4% in the past year, Standard & Poor’s said Tuesday.
The 20-city Case-Shiller home price index fell 2.2% from February to March. This is the 16th consecutive decline in prices.
And for 10 major cities, prices fell by 2.4% in March and by 15.3% for the past 12 months.
S&P’s Case-Shiller index tracks sales of the same homes over time, so it’s not influenced by the mix of homes sold in a period. However, it closely tracks only 20 cities, many of which had participated in the housing bubble earlier in the decade.”
Okay, not much of a surprise there with that news. We all expected that prices would continue on their downward trend simply because the amount of distressed properties on the market is going to bring the overall aggregate price measures down. The year over year drop of 14.4% is rather astounding given that prior to this housing bubble, we have never witnessed a year over year median price decline since the Great Depression.
The sharpest declines of course are happening in major bubble areas such as Las Vegas (down a stunning 25.9%), Phoenix, and Miami. In the same day news cycle we get that home sales actually went up last month:
“NEW YORK (CNNMoney.com) — New home sales rose unexpectedly in April but remained near historically low levels, according to a key government report on the battered housing market.
April sales came in at a seasonally adjusted annual rate of 526,000, a Census Bureau report showed, up 3.3% from a revised 509,000 in March. The reading was above the consensus forecast of 520,000, according to economists surveyed by Briefing.com.
But home sales were down 42% from a year earlier. April’s reading was the second-lowest annual rate since October 1991, behind March of this year.
“The momentum is still downward, and that April number is still weak,” said National Association of Home Builders chief economist David Seiders. “April marks only a partial reversal of that steep March decline.”
Clearly the market is gravitating to the massive price drop more than the meager rise in sales which is still at a historical low. But make no mistake about this; home sales will increase if the price is right. These two reports although contradictory on the surface make perfect economic sense. Lower prices are bringing more people into the market to purchase homes.
Calculated Risk as usual has an excellent piece discussing the current sales numbers:
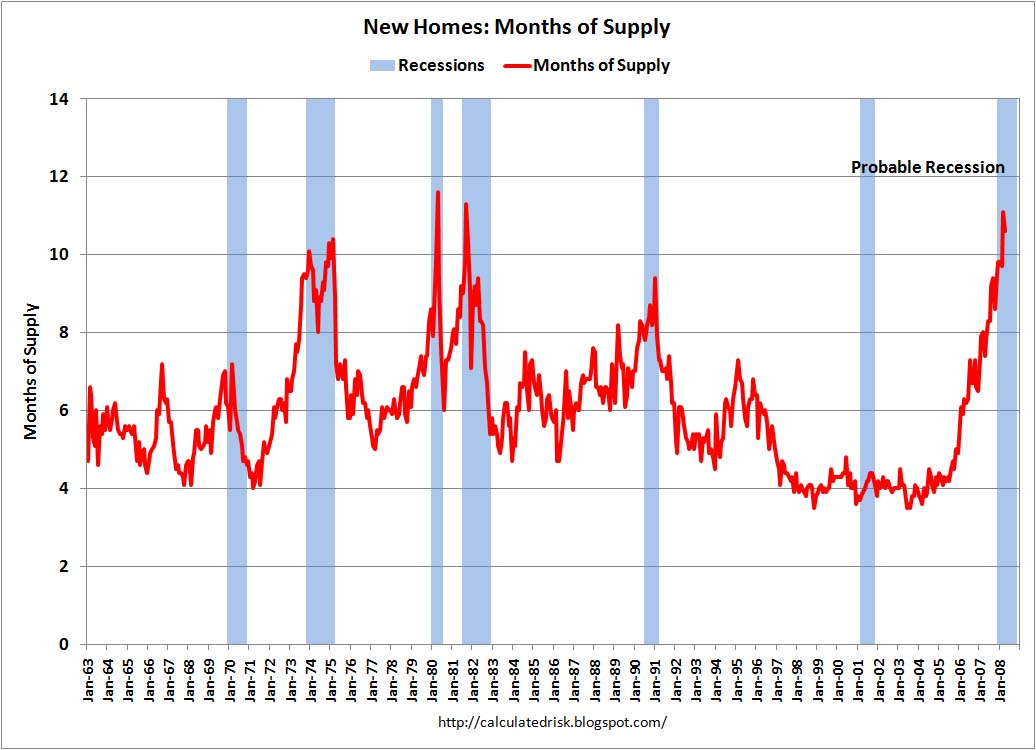
*Source: Calculated Risk
So even though there was a slight movement up in sales as you can see from the graph, we are still at historical highs and months of supply which really is the true barometer of market health is still very high as well. Most historical trends show a healthy market having about 6 months of supply. To highlight this trend let us look at Los Angeles and Phoenix from the latest report:
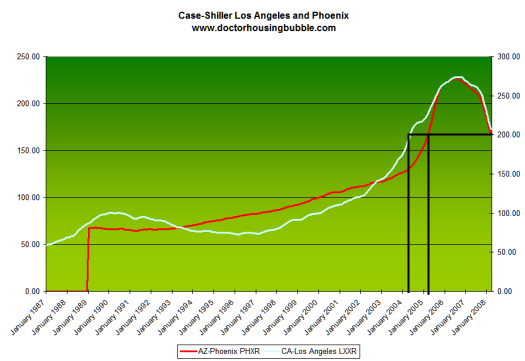
You can already see that Los Angeles at least according to the Case-Shiller Index is back to early 2004 prices and Phoenix is now back to early 2005 prices. Los Angeles from its peak in September of 2007 is now down 24.3% and Phoenix is now down from its peak in June of 2006 a whopping 36.2%. Keep in mind that for Los Angeles, we should expect as we get closer to the yearly anniversary of the peak should prices stay low, to see a 30 to 40 percent yearly price drop.
The logic is simple here folks. Prices need to drop substantially for sales to increase. The two reports simply reaffirm this age old economic wisdom.
 Did You Enjoy The Post? Subscribe to Dr. Housing Bubble’s Blog to get updated housing commentary, analysis, and information
 Subscribe to feed


5 Responses to “Housing Contradiction: Home Prices Down = Sales Up. Any Questions?”
Another great post. Thank you.
Although it brings back to mind my hoendous experience with micro economics 101 in which I received the lowest mark in my Uni experience( even though I loved the subject)
I now understand elasticity and substitution. (I am currently substituting a 57 foot schooner in the Bay area). I also now undestand that it is not yet a good time to buy.
Very well supported analysis. Could you comment on micro-markets? There are many areas (including the area in which I work as –gasp!– a real estate agent, where prices have dropped only slightly and well-priced nice homes are still occassionally selling with multiple offers. Given that for most people a home is not only a financial investment, but a place in which to live and build a life, waiting may not be the best option for everyone. And how do you know when you’ve reached the bottom?
Kerin- let me see if I can provide an answer. Perhaps I can reprise a higher microeco mark!
The good Doctor refers to elasticity and substitution. With higher end homes( with designer swimming pools, flagstone hearths, granite tops and one off designs, there is significant demand but no substitution available, at least, to date. The supply line is higher up the price axis (less supply) and higher value. Demand is less, but so is supply with no substitution available ( I am not moving into a cookie cutter rancher with stock cabinets- I am not elastic on that at all!!). Of course these homes are the last to feel the downward pressure.
Kerin where do you work? Its not the alien plant where the aliens go in the new Indiana Jones movie (which is horrible) is it?
Sometimes I have a hard time reading the Docs excellent posts, probably due to lack of caffeine. If I understand correctly, you’re recommending that rents are radically increased to make buying houses at inflated levels more competitive? 🙂
Leave a Reply