California Housing Report: Southern California Inventory Dropping but Foreclosures Keep Coming. Los Angeles and Orange Counties Plagued with Problems.
Housing is nowhere near a bottom. Housing is nowhere near a bottom. Did you get that? The lovely media spin machine has been digesting recent reports from housing pundits about the decline in overall inventory. The pundit’s explanation is simple. Inventory is going down because sales are increasing therefore things are fantastic! This not only misses the entire scope of the problem but also is misleading to the public. It would be nice if the media talked about some of the 10 reasons housing will not bottom out in California until May of 2011 with little economic factors such as unemployment, REOs, shady lenders, and other factors but why pay attention to that right? Housing in California is in the shambles and will remain this way for many years.
Remember that mighty Fannie Mae and Freddie Mac bailout? You know, the one that put the taxpayer at risk for beacoup money and was suppose to stabilize the market? Well after a 286 point DOW rally on Monday the DOW un-rallied by nearly 280 points on Tuesday. The largest bailout in the history of our nation and it only gave the market a one-day rally! Bwahahaha. I’m sorry folks, this crony capitalistic bailout was aimed at a very select few people and at what point do you simply stop believing that “too big to fail” mantra? Let us do a quick recap:
August 2007:Â “Credit markets in the world are too big to fail.”
Action: The Fed took an axe to rates injecting liquidity. Didn’t work because you can’t inject solvency.
August 2007-March 2008: “We need to provide new facilities for lenders to provide further liquidity. This is too big to fail.”
Action: Alphabet soup of facilities to exchange filthy mortgages for Treasuries. Didn’t work because mortgages were still dirty and toxic.
March 2008:  “Bear Stearns is too big to fail. The counterparty risk will unleash economic Armageddon if we do not bail them out.”
Action: Treasury/Fed/JP Morgan bailout. Look how well that stabilized the market.
July 2008:  “We need the Housing and Economic Recovery Act of 2008. The American homeowner is too big to fail.”
Action:Â Crony capitalistic program that when you read the details, will not stabilize the market whatsoever.
September 2008:  “Fannie Mae and Freddie Mac are simply too big to fail. No seriously, this time we really mean it. Trust me, I’m from the government.”
Action: Put the taxpayer at risk for what will be the biggest bailout in global history. And yet they have the gall to say it “may not cost anything” – seriously, the next administration better bring that line up in Congressional perp walk hearings.
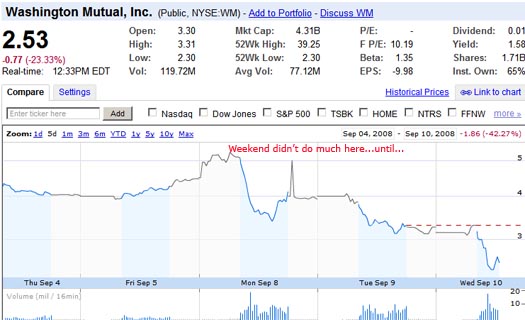
That brings us to today, where we now see another i-bank with Lehman Brothers facing problems that are “too big to fail” and under the radar, Washington Mutual is now walking a fine line. Washington Mutual is one of the poster representatives of Option ARM mortgages and have a boatload of these loans in California. Overall, California holds about $300 billion of these toxic time bombs that are setting off in a chained reaction. Over the weekend, WaMu replaced the CEO of the company and since then, in the last 2 days the stock has tanked. In fact WaMu is down 42% in the last 5 days and down 92% in the last year:
Now why is this a big deal? Remember the Indymac Bank failure. Well Indymac at the time of takeover only had about 8,169 employees and $32 billion in assets. Let us quickly look at WaMu:
Full Time Employees: Â Â Â Â Â Â Â Â Â Â Â 43,198
Assets:Â Â Â Â Â Â Â Â Â Â Â Â Â Â Â Â Â Â Â Â Â Â Â Â Â Â Â Â Â Â Â Â Â Â Â Â $309 Billion
Liabilities:Â Â Â Â Â Â Â Â Â Â Â Â Â Â Â Â Â Â Â Â Â Â Â Â Â Â Â Â Â Â $283 Billion
Current Market cap:Â Â Â Â Â Â Â Â Â Â Â Â Â Â Â $4.4 Billion
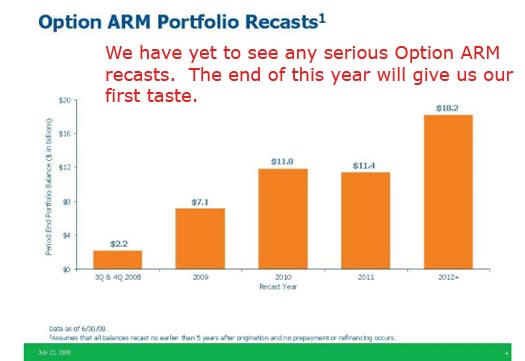
The numbers are not looking pretty. And we need only look at the Option ARM breakdown and we see how some of these “assets” are going to perform in the next few months:
Now keep all this information in mind as we now move on and dissect the misleading inventory numbers for Los Angeles and Orange Counties.
Los Angeles County
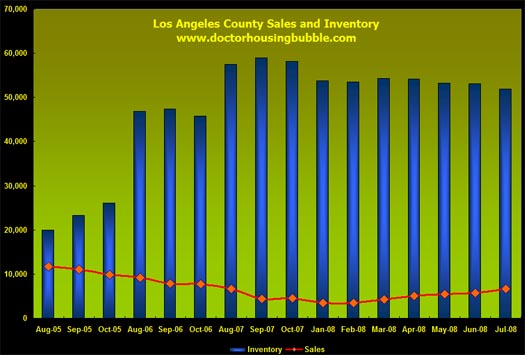
I want to be very clear that inventory in Los Angeles County is declining. Yet the rate at which the media and pundits are spinning is simply not the real deal. First, let us a take a look at a chart that I compiled using monthly inventory and sales for the county:
Â
First, you will recognize that peak bubble delusion days of August of 2005. During these bubble months, at one point there was only 1.7 months of inventory! That is, at the rate sales were going and homes were getting financed by those wonderfully toxic Alt-A and Option ARMs, the market would clear out all inventory in slightly under 2 months for a county with 10,000,000 people! Insanity. Let me calculate a few of the month to sales ratios for the chart above to give you some perspective:
August 2005:Â Â Â Â Â Â Â Â Â Â Â Â Â 1.7 months to clear inventory rate
August 2006:Â Â Â Â Â Â Â Â Â Â Â Â Â 5.9
January 2008:Â 15.8Â (peak for LA)
July 2008:Â Â Â Â Â Â Â 7.87Â (2 year low…or is it?)
See, this kind of information is what is misleading people and has led many people back into the market only to find out that there is still much more to fall in terms of prices. Take a look at the actual overall inventory above. It is still very high. Yet you need to remember that slight bump in sales numbers is because of distressed properties. In fact, in Southern California 43.6% of all sales are distressed properties. If we are to eliminate distressed sales, you would realize that the numbers would not look so pretty. In fact, eliminating distressed sales from the above data gets us approximately back to the peak inventory/month ratio once again.
You also have to remember the shadow inventory numbers that don’t make their way onto the MLS. I’ve noticed many REOs simply are not finding their way to the listing service which much of the above numbers are calculated from. So this again has the potential to artificially lower rates. In addition, the market is so abysmal that those who do not need to sell are pulling their homes off the market leaving homes that are in desperate need of selling as much of the inventory. Many of the distressed properties are selling at rock bottom prices and we are now at a race to the bottom. Appraisals look at recent comps in the area, normally 3 to 5 homes and come up with an average price based on similar features such as square footage, amenities, and home location. So if half of the homes that are selling are distressed, the comp pool all of sudden becomes homes that are being marked down like crazy thus forcing your appraisal to be low as well. That is why during the bubble days, I always tried to drive this point home but to no avail. Appraisals mean very little in manias and subsequent busts because price action moves too quickly. Appraisals work in stable markets which is something we are not in.  People believed what they wanted and now reality is setting in. Let us look at the price for Los Angeles County:
Current Median Price Home:Â Â Â Â Â Â Â Â Â Â Â Â Â $400,000 *DataQuick
Peak Price:                                         $616,230 *C.A.R. (Feb of 2007)
The above drop is about 35%. I also wanted to use 2 different sources to drive a point home that prices got so out of control, even peak prices were off by tens of thousands of dollars from various data sources. The peak price from DataQuick is $550,000 for Los Angeles so the county is off on their numbers by 27% from the peak. Either way, the numbers are still non-sense given the massive run-up in prices.
Realistically most people when they think of a housing bottom they think in terms of price. And price for Los Angeles County will not bottom until 2011.
Orange County  Â
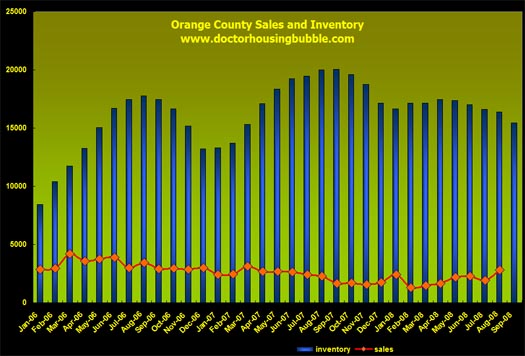
Looking at the Orange County chart brings up much of the same issues that Los Angeles has. Aside, from typical brainwashed reports, the bulk of people in the “OC” do not live in Newport Coast or Laguna Beach. Many people live in Santa Ana, Anaheim, Garden Grove, Tustin, and other parts of the county that have more middle class households. Yet prices in the entire county went sky high because of bubble delusion. Let us look at the chart for this county:
Now the chart looks very similar to Los Angeles. There has been a recent spike this summer but in the overall context of things, doesn’t signify a bottom. Let us look at a few key ratios of inventory burn off rates:
January 2006:Â Â Â Â Â Â Â Â Â Â Â Â Â 2.9
January 2007:Â Â Â Â Â Â Â Â Â Â Â Â Â 5.5
September 2007:Â Â Â Â Â Â Â Â 12.1
February 2008:Â Â Â Â Â Â Â Â Â Â Â 13.3 (peak for OC)
August 2008:Â Â Â Â Â Â Â Â Â Â Â Â Â 5.8
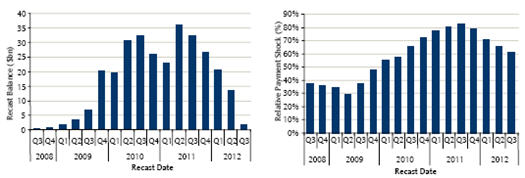
So again, if we are only to look at this one single point which many pundits are, then yes it “looks” like things are improving but they really are just suckering in more people before we hit the most devastating leg of the market downturn. Below is a new chart by Barclay’s showing the Option ARM forecast:
According to their data, these loans represent 15% of securitized loans and there are about $300 billion in option ARMs and $820 billion in interest only mortgages set to recast whether it is because of caps being reached or anniversary dates. So it looks like some of the numbers have been revised recently. Either way, the payment “shock” is going to send a ton of people walking away. Just look at Q4 in 2009. That is when things really get interesting. California is nowhere near a bottom.
Someone sent me a link to this picture of WaMu’s wonderful ad placement:
*Source:Â Giggle Sugar
Right next to a strip club. You got to love that phrase. How can we describe the housing market in California? Whoo Hoo!
 Did You Enjoy The Post? Subscribe to Dr. Housing Bubble’s Blog to get updated housing commentary, analysis, and information.


 Subscribe to feed


11 Responses to “California Housing Report: Southern California Inventory Dropping but Foreclosures Keep Coming. Los Angeles and Orange Counties Plagued with Problems.”
The cast of the smash hit movie “Airplane” were on the Today show this morning. To rewright a line from Robert Hays, when the arms reset the shit is really going to hit the fan.
Believe me, nobody not even Hanky panky Paulson will have any idea what to do when the big problems arise. Wamu & leaman Brothers are just the tip of the iceburg.
“We have clearence Clarence, roger Roger, what’s are vector Victor.”
Sorry, I love that movie, Iwas channeling it while posting.
I think that numbers of the realtards are more or less showing some improvment but this is all due to the uptick in sales in areas of LA county 20 miles away from the beach, because of the prices there geting closer to reality faster. The only mantra ot the realtards which can hold some truth is :”All markets are local” . And this good explanation what is happening now. Ant is that: the west side is frosen and will not be able to witstand this winter storm. I am closely following what is going on in Torrance, Redondo Beach, RPV, Huntington beach and there is no inventory reduction, exactly oposite inventory very slowly piling up, because despite other areas uptick in sales here there is no rush for match box houses for $700 000. No surprice, ha!? What I am expecting is prices in “not so afluent” areas have very litle to go down from here, may be 10-15 % , but on other side ( the west side) the fun has is just began, for some…
http://latimesblogs.latimes.com/laland/
“From Calculated Risk, which also offers a link to the Lehman conference call:
“[The Lehman] base case assumes national home prices drop 32% peak to trough, vs. 18% to date, with California down 50% vs 27% to date.”
Ian T. Lowitt, Lehman CFO”
Sense the inland empire has been in worst shape for a longer time will it bottom first? If so 2010 or could it bottom in 2013 because there is so much over building .
At this rate it won’t be long before it will actually be affordable to buy a house and live in California
I read today that the fed is considering lowering interest rates again before the year is out. Will this help people with Option Arms stay in their homes?
Ok, i got it, I know i screwed up by not jumping in, and then out-quickly during the upswing of the bubble, but is there a way to make the easy buck during this downward spiral?? If the answer is no, Ill just go back to watching “flip this house” and curse at the screen just like my buddy yells at the TV during Raider games.
With all those gutted REOs there might be a business in flipping again, but you’d really have to know what you are doing, move fast, but it would be risky and profit margins smaller.
Biggest bailout in history and the dollar gets stronger. Go figure! Wonders are how the rest of the world is fairing thru all this.
Westside of Los Angeles is just starting to get hit. Last August (YOY) Total Sales Volume dried up. 31-69% drop…..
The Biggest Losers in order were:
1) Beverly Hills
2) Marina Del Rey
3) Venice
4) West Hollywood
5) West LA
6) Culver City
7) Pacific Palisades
8) Santa Monica
http://www.westsideremeltdown.blogspot.com
If shadow inventory doesn’t show in MLS, how do we know how much actual inventory there is?
How is that shadow inventory actually sold w/o being placed on the MLS? Is it sold through only designated listing agents or auction only?
Leave a Reply