Public opinion is a permeating influence, and it exacts obedience to itself; it requires us to drink other men’s thoughts, to speak other men’s words, to follow other men’s habits.
-Walter Bagehot
To turn on the television or read a national newspaper, you would think that each housing market has suddenly burst in perfect unison. It’s as if every housing market suddenly turned on a dime because of the “credit crunch†that started in August of this year. Even last year, I had colleagues in the field telling me that housing was only in a slight dip and all would be well once again. They couldn’t see two steps ahead because of their dogmatic view that housing was a bastion of stability and never edged down. In fact, turning on the mainstream media during this time you would also see the food that was feeding their belly and this was a reinforcing loop of faith in housing. Now, these same colleagues have a more bearish and pessimistic view on housing yet many don’t understand the nuts and bolts of what is occurring. They say things like “suddenly†or “out of the blue†when in fact, the warning signs had been flashing for many years but they didn’t want to see them. Public opinion is a fickle flame. It can burn brightly for many years and suddenly blow out over night. There is no doubt that the man on the street and the talking heads are now saying the same thing; housing is in for a decline.
Peaks are only noticeable after you start descending. So by their nature, you can only pinpoint a peak once you’ve started on a decline. Today we are going to examine five metro areas in the United States all with different peaks and all with varying degrees of housing prices. In fact, one of the areas has completely avoided the housing bubble. We will be looking at sales data from the Case-Shiller reports that are put out at the end of each month. These tend to show a more accurate reflection of market price since they look at sales on a single home over time. The five metro areas are, Los Angeles, San Diego, Charlotte, Miami, and Phoenix. We’ll go from the first of these areas to peak to an area that avoided the bubble completely.
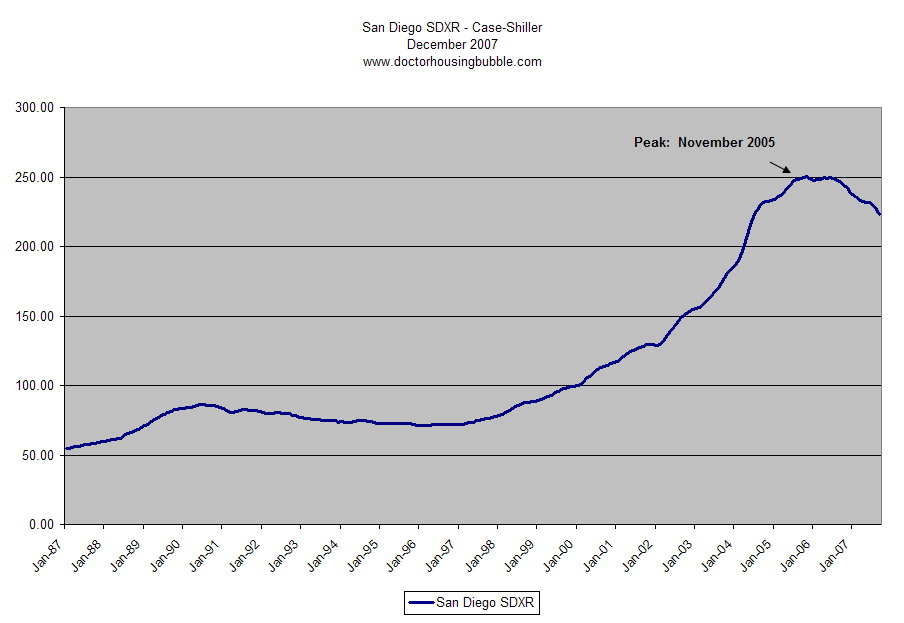
San Diego – Peak Reached November 2005
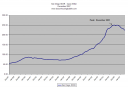
San Diego is a great place to be. Nice beaches and near perfect whether throughout the year. These qualities made it one of the first places to enter the housing bubble coal mine. Prices went into the stratosphere and reached unbelievable peaks where 900 square foot condos were selling for $500,000. The mania seemed unbelievable and set the stage for absurd mortgage products to keep up with the speculation. San Diego has a population of 2,941,454 with a 55 percent homeownership rate. This is in sharp contrast with national homeownership rates of 70 percent. You’ll notice that the more expensive bubble metro areas have a larger renting population. This should be obvious since the more something costs the less people can afford it. The median income for those in San Diego is $51,939 according to 2004 data; at a certain point median home prices were 10 times higher than the median household income. You’ll notice that San Diego was one of the first to enter its peak but also linger at the top for sometime. Why is this? Well we were still in a national housing obsession and NINJA products were still floating around thus supporting further speculation. The fact that they entered their peak first only allowed them to stay at peak levels for a longer time than other areas.
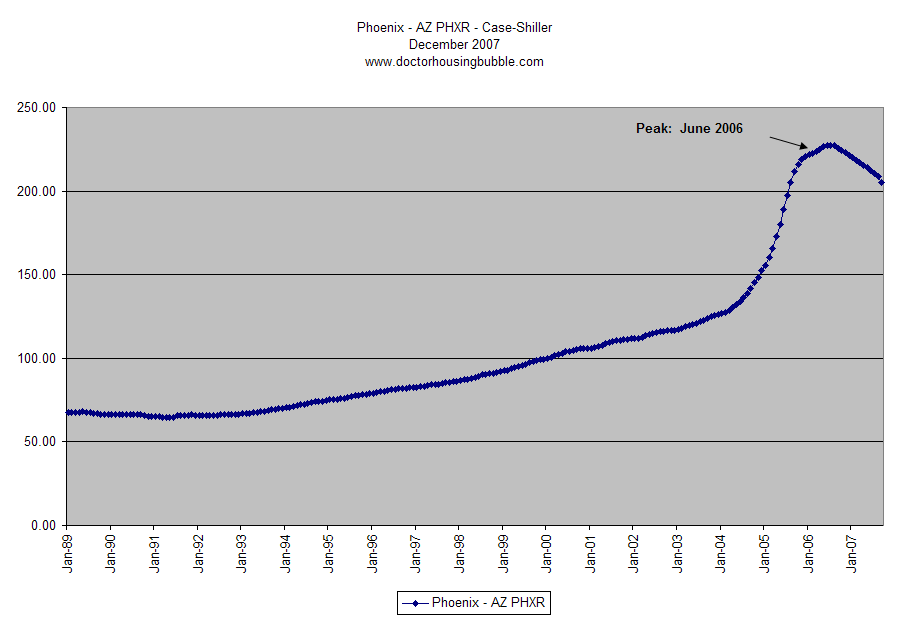
Phoenix – Peak Reached June 2006
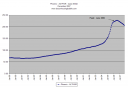
The valley of the sun benefited greatly from California Equity Giants looking to leave the state for more affordable housing or people looking for investment properties. Price growth in Phoenix was one of the sharpest but has also fallen the quickest. With unbelievable amounts of inventory this market went up way too fast and is coming down just as quickly as it went up. Now that credit is tighter and California Equity Giants are looking more closely at their equity and realizing they cannot tap into it, halo markets are having very tough times. You can also compare the drop in Las Vegas to situational circumstances that Arizona is facing. The city of Phoenix has 1,388,416 people and many more in the metro area. The homeownership rate is at 60 percent and the median household income is $41,207. Again you start to notice the divergence of price and local area incomes. The argument for many years kept going on that local area incomes didn’t matter since prices would simply keep going up. At a certain point, which is now, we are back at fundamentals and down payments and incomes (even if they’re only 5 percent) make a large enough difference to tank the market. No longer do people believe in the myth that housing always goes up. As of today, the Phoenix area has 63,559 homes on the market, over one year of inventory at current sales rates.
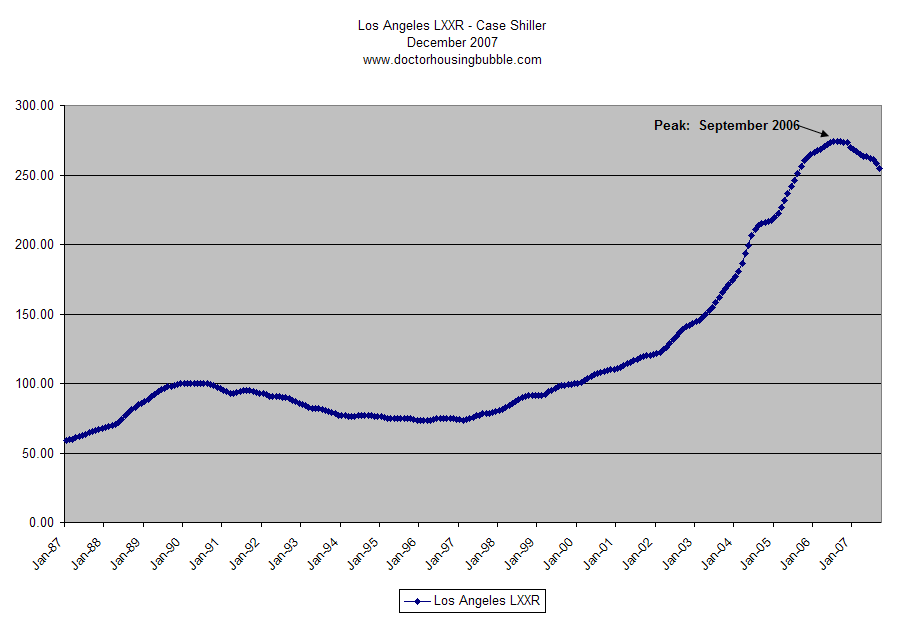
Los Angeles – Peak Reached September 2006
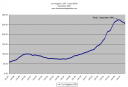
The Los Angeles metro area covers an incredible 88 cities with approximately 10,000,000 people. It is a large and complex concrete jungle. Los Angeles County has one of the lowest homeownership rates in the country coming in at 47.9 percent. In essence Los Angeles County is an area dominated by a renting majority. It has also been one of the last counties to show declines in its median home prices. Looking at DataQuick information Los Angeles County didn’t go negative year-over-year until October of 2007! You know that last time DataQuick showed the county going negative year over year? You would need to go back to the early 90s. In fact, Los Angeles county was at a double-digit appreciation rate from March of 2001 until May of 2006. That is an incredible five years of double-digit gains! In fact, a few of these years saw consistent 20 percent annual gains. Clearly this is one of the largest and overpriced areas and even though it is one of the last to fall, it will be one of the hardest. What kept Los Angeles up for so long? For one, we have an inordinate amount of exotic mortgage products. In August of 2005 a study reported that ARMs made up 70+ percent of all mortgages. What was Alan Greenspan saying in his recent mea culpa that ARMs didn’t support this bubble?
“I do not doubt that a low U.S. federal-funds rate in response to the dot-com crash, and especially the 1% rate set in mid-2003 to counter potential deflation, lowered interest rates on adjustable-rate mortgages and may have contributed to the rise in U.S. home prices. In my judgment, however, the impact on demand for homes financed with ARMs was not major.
Demand in those days was driven by the expectation of rising prices–the dynamic that fuels most asset-price bubbles. If low adjustable-rate financing had not been available, most of the demand would have been financed with fixed rate, long-term mortgages. In fact, home prices continued to rise for two years subsequent to the peak of ARM originations (seasonally adjusted).â€
I guess Alan Greenspan wants to see 90 percent ARM and Option-ARM rates before slapping on that major label. And here is another major issue that is mixed in with the current housing bust; a large part of America did not see massive speculation! Many large metro areas participated in the bubble and a large portion of the most dangerous mortgages are in high priced states. WaMu and Countrywide both have approximately 50 percent of their entire mortgage portfolio in California. Fannie Mae and Freddie Mac have about 15 to 20 percent. A large portion of it is based out here in this banana republic. So when you here “housing is still largely affordable in many states†you can tell them “but a vast portion of all outstanding mortgage debt is here in sunny SoCal.â€
Miami – Peaked Reached December 2006
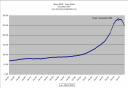
Miami is another major bubble zone. They are facing some of the steepest drops in prices and this is largely due to a massive overbuilding. You can read this great synopsis of the past Florida housing bubble in the 1920s and you will think you were reading something out of today’s Miami newspaper. Speculation ran to an unbelievable feverish pitch in Miami. Florida was going haywire and building cranes littered the skyline. In fact, there was a 600+ condo project where it was reported that over 200 units were entered under “shady†circumstances. We all know what that means. Florida, like California has beaches and sunny weather and this is always used as a selling point. People buy this up especially people in the North-East who have equity and want a resort getaway. They had East Coast Equity Giants (ECEG) buying up places. In fact, this week Suze Orman had a woman from New York that wanted to know how to get out of a really bad real estate deal on a “pre-fab†that was bleeding her dry for $3,000 a month. The response? Foreclose.
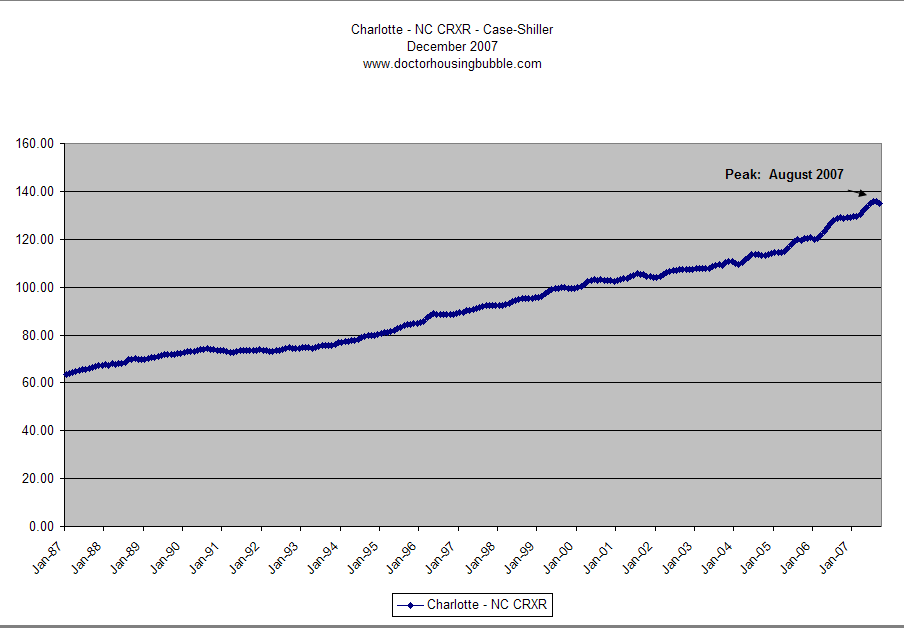
Charlotte – Peak (High Point) Reached August 2007
I wouldn’t exactly call Charlotte North Carolina a peak. If you look at their chart, you’ll notice one thing that is not represented in the others. Steady and even growth. You’ll also notice that prices are only slightly moving lower. This national housing bubble will bring many areas down because as I and many others believe, we will be pushed into a recession. For purposes of most people and their daily life, we are already in a recession except the text book definition is two consecutive quarters of negative GDP growth. A recession just like housing peaks, is only noticeable after the fact. But ask any person in the housing industry or ask anyone in construction if they think we are in a recession and you will receive an affirmative. There are many places like Charlotte that must think what in the world is going on with the coastal regions of this country? John Edwards uses the term “two Americas†and in housing this is absolutely true. You cannot look at the above charts and not see that there are two very different worlds that we are living in. So this is the tale of 5 large areas, not all equal, and not all created the same but all having varying degrees of pain from the housing bubble. The magnitude of pain for each area will depend on how much they dabbled in the black mortgage magic and California, not only dabbled in this magic but created much of it.
 Did You Enjoy The Post? Subscribe to Dr. Housing Bubble’s Blog to get updated housing commentary, analysis, and information
Did You Enjoy The Post? Subscribe to Dr. Housing Bubble’s Blog to get updated housing commentary, analysis, and information


 Subscribe to feed


6 Responses to “A Tale of 5 Cities: Not All Bubbles Burst at the Same Time.”
Thank you for another good article DrHB. You have two good atributes, you can write, and you have something to say! Frankly, I don’t know where you find the energy.
Thanks Dr. Housing Bubble. So do you think prices will fall to 2001 prices or lower.
thank you for your site,
I would love to see how San Francisco compares to these other cities. All we hear is that SF is immune and I refuse to believe that.
Fascinating article, as always. Greenspan may be a smart man, but “free money” is going to upset all kinds of balances and we are seeing that play out still (and moving toward doing it again!!)
A few small word swaps that make things more poetic than you probably intend:
“Nice beaches and near perfect whether throughout” –“weather”
“So when you here “housing” — “hear”
@oilwelldoctor,
Appreciate the comment. Lots of information is flying out there.
@all:
12-14-2007 Weekly Southern California Short Sale Report
http://www.doctorhousingbubble.com/forum/viewtopic.php?p=340#340
14 percent of all homes on the market in San Diego are listed as short sales.
D.C. peaked in July of 2005. Sold a 1br condo for $545,000. Absolutely crazy. Resale volume finally killed the market immediately thereafter…and this was prior to the 53k planned units coming on the market in late ’05-2007.
Leave a Reply