
10 Percent Unemployment in California: Which Counties are Hurting the Most and What it Means for Housing.
The real health of a nation is derived from a citizenry that is employed adequately. The debate over what “adequate” constitutes can be debated but it is sufficient to say that the way current national data is gathered for employment is simply inadequate. People are undercounted. Even with the report that was issued on Friday demonstrates a much more disturbing trend beside a rise in the unemployment rate. What we are seeing is higher paying jobs in professional, construction, and manufacturing being replaced by lower paying service fields. With wages remaining stagnant over the past decade, reduction in household income does not bode well for our nation but it only further cements a difficult time ahead for the housing market.
In past recessions, housing has always retracted and declined during these times because people logically do not make big purchases during tougher moments in the economy. A good indicator is looking at housing starts and their progressive declines months before official declaration of a recession:
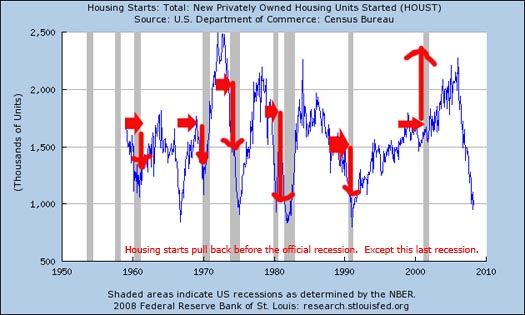
You’ll notice the typical pattern in the past but the last recession in 2001 set off a boom in housing which hasn’t been seen in the history of this nation. This has been the largest housing boom the world has ever seen in terms of money. As you’ll also notice in the chart, every previous recession aside from 2001 was preceded by a steep drop in housing starts. Take a look at the housing starts above. That constitutes a historic drop in time and trajectory. Yet even as we see the largest jump in employment in 2 decades, we are told that we are not in a recession:
“WASHINGTON (Reuters) – The sharp jump in the U.S. unemployment rate in May to its highest in 3-1/2 years is “too high for our liking” but represents slow growth, not a recession, White House spokesman Scott Stanzel said on Friday.
“This isn’t a report that we wanted to see today,” Stanzel told reporters after the Labor Department said the jobless rate rose to 5.5 percent last month from 5 percent in April, to its highest since October 2004.”
The problem of course is the method used by the government to calculate employment already understates real unemployment by 4 or 5 percent. Even within the recent report we are told that the unemployment rate is closer to 9.7 percent when we factor in those who have stopped looking for work and those that are underemployed working part-time. Clearly the numbers can be worse when we dig deeper into the data. And a state such as California is reflecting this reality.
Let us dig into the most recent unemployment numbers for California and separate out the counties to get a better sense of what is going on.
As of April 2008 the statewide unemployment number is 6.1 percent. Yet this number does not accurately reflect the actual pain certain regions are facing. There are many counties in the state that are facing a double whammy. First, they are facing the brunt of the housing crash. Second, their unemployment is increasing at an astronomical pace:
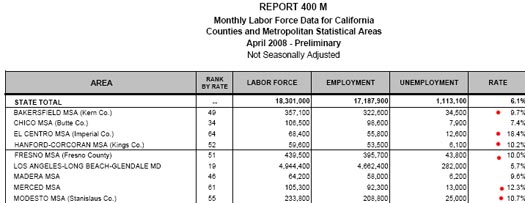
What you’ll find in the above chart is California is not a balanced state. We have many counties that have 10 percent or higher unemployment rates. Some large counties like Fresno and Merced are facing that two hit punch I was talking about. Many of these areas have some of the nation’s highest foreclosure rates and it isn’t necessarily because housing prices are declining. These areas had higher unemployment rates to begin with but many of these places were also dependent on jobs that directly went up or down with the way the housing market responded. The cushion wasn’t strong enough and that is why we see tough times here. Let us quickly take a look at a Fresno snapshot to see what is happening in their housing market:
Median Price: $237,250
Last Year Median April 2008 price: $280,000
Drop of 15.27 percent
Given that certain areas in California are down 30 or even 40 percent, this may not seem so bad. But the problem is Fresno’s housing problems started much earlier than problems in areas like Orange and Los Angeles County. From peak they are down 30 to 40 percent. And looking back up at the employment chart, you’ll see that Los Angeles is at a rather healthy 5.7 percent but this has been rising rapidly recently. Expect higher foreclosures and unemployment in the near future. To put the 10 percent rate into perspective, the Inland Empire which has been hit so incredibly hard has unemployment at 6.8 percent:

This 6.8 percent rate has caused the county to have a housing market that is in a free fall zone:
| All homes | Apr-07 | Apr-08 | % Chng |
| Riverside |
$409,000 |
$295,000 |
-27.90% |
| San Bernardino |
$370,000 |
$265,000 |
-28.40% |
*April 2008 data: DQNews.com
This is why employment, at least in California, has everything to do with how deep housing will come down. After all what is the use of a home dropping from $1 million to $450,000 if you don’t have a job? This is a little discussed housing factor that’ll be making more headline news soon. The last few years the obsession with California housing was based on this phantom equity disappearing. It was more an academic exercise since if you weren’t planning on selling, what did it really matter? Well it does matter because people feel poorer when their perception of wealth is taking a hit. That was the last few years. Now, it isn’t only perception but it is full fledged reality. And this is what the stock market realized on Friday:
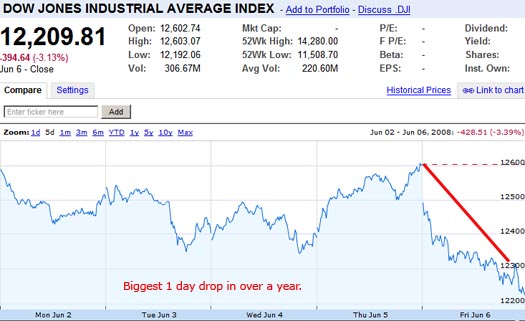
The stock market faced its biggest one day drop in over a year with the news that employment wasn’t as rosy as it should be; this forced the tough hot air blowing of the Fed earlier this week of maybe raising rates later on this year off the table. The subsequent drop in the dollar was further fueled by the European Central Bank doing the right thing and taking a strong stand with rates. Oil was the big story jumping a stunning $10+ in a single session, the largest ever on record! Guess what that’ll do for folks thinking about buying in the Inland Empire and commute into Los Angeles or Orange County? Unless they ride a Vespa, I wouldn’t expect many people to make this choice simply because they cannot afford it. All these things of course are tied into each other but it was simply a capitulation event reflecting reality.
Employment isn’t healthy. Our nation is in massive debt. Housing will not be recovering for a few years. This denial is absolutely stunning. In fact, CNBC on their website at the end of the day yesterday had a headline that read, “record drop in stocks. Great buying opportunity.” Sort of like the people that thought it was a great time to buy a home last year?
The California numbers have a lot to do with the state of the nation simply because of the size of our economy. Also employers such as WaMu, Wachovia, and Countrywide have branches in other states that employ thousands of people yet incredible amounts of their mortgage debt are tied to California. If housing continues to decline through the usually good summer season (we have June, July and August) then it will be a bloodbath for fall and winter. This is the time for housing to mount and build a buffer zone but looking at the hard numbers, where is this going to come from? Yes, Fannie and Freddie can raise caps to $729,000 but what use is it if people simply do not have the income to meet even modest underwriting requirements? Ed McMahon is having trouble paying his $4.8 million dollar loan to Countrywide so this isn’t simply a subprime issue. Slowly the reality is seeping in.
Be careful if you are deciding on jumping into the stock market or are looking at buying a home in the current environment. The best time to buy a home is in the winter when there is very little foot traffic (sort of like buying a car off a lot on a rainy day). Why would anyone rush into the market right now especially here in California?
 Did You Enjoy The Post? Subscribe to Dr. Housing Bubble’s Blog to get updated housing commentary, analysis, and information
 Subscribe to feed


7 Responses to “10 Percent Unemployment in California: Which Counties are Hurting the Most and What it Means for Housing.”
Argh! With gas around here close to $4.50 for unleaded and the Dow cratering, it’s gloomy, indeed. Headlines in San Diego yesterday were all about bleak futures.
Wanted to let folks know there is a fascinating article about what the popping of the housing bubble means for us–July issue of Atlantic Monthly.
About the statistics of unemployment, like all the other number, nobody think it’s perfect, but since it has been gathered the same way for decades, so it distorts fact in a consistent way.
About he house market, in Bay area, majority place is suffering decreased sale and price, but still there are many place looks bubble proof, e.g.Alameda, 94501,, last year (till 04/30), price increase 3.4%, in san francisco, 94121, price increase 15.5%, sales increase 5.6%, Moraga, where i want to buy a house, price increase 3.5%, sales 0% change.
In a sea of red, you can see so many green spot, unfortunately, majority of the green spots are where I want buy a house.
Dear Doctor and fellow readers:
I have been reading this blog, so cal housing crash, and the Irvine blog for the last two years or so. I have learned so much from these blogs and I thank you for that. I live in Riverside and plan on buying in Riverside. Home prices here have been declining a lot. However, I still believe that we still have a long way to go. I have learned that the median prices in an undesirable city such as Riverside (weather, commute, lack of job opportunities), should not be more than 3 times the median income. From my knowledge, I believe that the median income here is around 55k per year. Thus, median price should not be more than 165k. However, the median here is still around 300k. Therefore, I believe we still have another 45% drop ahead of us. Am I wrong ??? Please let me know what you think. I have been waiting for the right time to buy. Nothing fancy, just a place to call my own. Thank you all for your help. Thanks again.
As ever Dr HB you are right on message. I read your blog religiously,as I always come back to the same question, where are people getting their money from to afford these houses? It really does interest me that, although to me all you write is common sense knowledge, the mainstream media fails to report anything remotely that you will find here. Keep up the good work.
http://www.youtube.com/watch?v=AqgePGsDqzs&feature=user
@Norman:
“unemployment, like all the other number, nobody think it’s perfect, but since it has been gathered the same way for decades, so it distorts fact in a consistent way.”
That would be true if the government never changed the methodology.
But many allege that politically-motivated changes made to the methods over the decades are significant. For instance, the use of “owner’s equivalent rent,” “hedonic” adjustments, the use of “core” inflation, etc.
See shadowstats.com (and maybe earlier posts here).
Others have pointed out that even when gas was cheap, and even if the costs of “stuff you buy at Wal-Mart” remained fixed, the major costs of being a middle-class American (going to college, buying a house, and going to the doctor) have increased phenomenonally.
Good observations. I always wonder how he or she is able to earn his/her living plus buy a house. Any time I am in constant search for some additional sourses to get money on my new house… but… The information provided in this post is so detailed that presents a big interest for the majority of us. Thank you so much, we are waiting for the new not less useful issues .
Leave a Reply